Insights


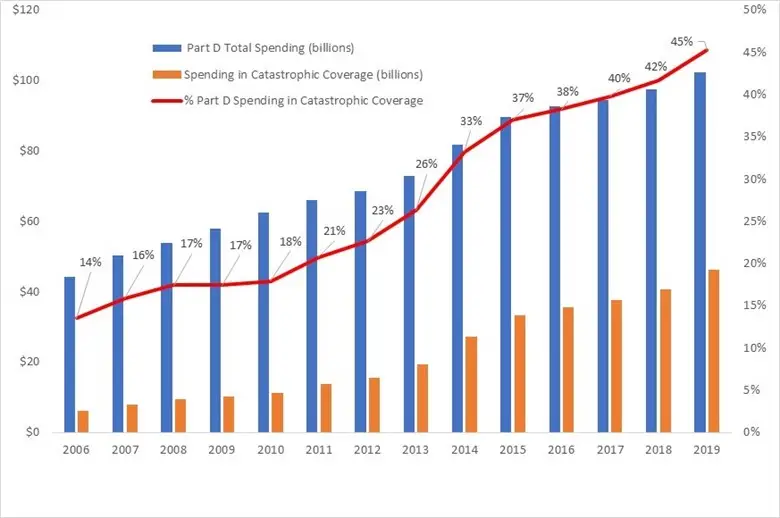
The Medicare Part D program, which was launched in 2006, is in the middle of its second decade of providing prescription drug coverage to Medicare beneficiaries. The Part D program has improved beneficiaries’ access to prescription drugs but at increasing cost. Federal spending for Part D has more than doubled from $44.3 billion in 2006 to $102.3 billion in 2019. This increase follows the increase in overall U.S. prescription drug spending [pdf] over this period.
Much of the increase in Part D spending has been driven by an increase in spending on catastrophic coverage. Catastrophic coverage is the phase of the Part D benefit with the highest spending threshold. In this phase, Medicare covers 80% of drug costs through what is called reinsurance (see here and here for a description of the Part D benefit design). Spending on catastrophic coverage has increased from 14% of Part D spending in 2006 to 45% in 2019. Much of this increase is from high-priced specialty drugs. These drugs include those for cancer, hepatitis C, rheumatoid arthritis, and multiple sclerosis. For example, Harvoni and Sovaldi, both hepatitis C treatments, have average list prices of over $30,000 per month. The use of specialty drugs is only expected to grow [pdf]
Part D Payment Modernization Model
Recognizing these trends, Medicare started testing its Part D Payment Modernization Model (PDM) in January 2020. This five-year model aims to reduce Medicare spending on Part D while preserving or enhancing the quality of care. Stand-alone Prescription Drug Plans (PDPs) and Medicare Advantage Prescription Drug Plans (MA-PDs) can volunteer to participate. The centerpiece of the PDM model is offering Part D plans shared savings under catastrophic coverage. Medicare shares savings if plans achieve spending below a target amount and plans share losses if spending exceeds a target amount. The target amount is calculated after the plan year and is based on spending from all PDPs or MA-PDs.
PDM also includes a grab bag of other components. One is giving plans the option to offer Part D Rewards and Incentive programs. These programs offer rewards to beneficiaries. For example, plans can offer gift cards conditional on getting vaccines or other preventative health services, for adherence to their medication regime, or for switching to generics or biosimilars. Another component regards plans’ Medication Therapy Management (MTM) programs. These programs aim to help patients use their medications in ways that are best for their health and wallet. For example, pharmacists can conduct reviews of a patient’s medications. These reviews may identify unnecessary drugs. Or they may suggest generics where the branded drug is no better. PDM offers plans more flexibility to design and target their MTM programs.
Plan participation
In the first two years of PDM, only two insurers have participated in PDM. To entice more insurers to join, Medicare had proposed to remove downside risk and relax restrictions on what drugs each plan needs to cover. However, Medicare has subsequently canceled these proposals. Without any changes to PDM, it’s unclear if many more insurers would join for future years. In addition, it is unclear what types of insurers have joined or will join the model. Are these insurers who already are efficient at controlling the use of high-cost drugs, or are they insurers with significant room for improvement? Based on Medicare’s experience with other voluntary models, the answer may determine whether PDM results in savings or losses to Medicare.
Potential impacts of the PDM design
Formulary design
Plans have many tools to control costs. The primary tool is the design of their formulary--the set of drugs covered under their plan and their associated cost-sharing. For example, plans can lower cost-sharing for lower-cost drugs or exclude higher-cost drugs from coverage altogether. In designing their formulary, plans must consider multiple factors. These include cost-effectiveness and beneficiary preferences. There may be a trade-off between controlling costs and covering drugs beneficiaries want. There may also be a trade-off between short-term and long-term costs. For example, plans may choose to exclude a higher-cost branded drug that may be preferred by beneficiaries due to ease-of-use or TV drug ads. Or plans may choose to cover a higher-cost drug that better treats a disease. This may result in higher short-term costs but lower future drug costs or avoided hospital visits.
Hypothetical example
To illustrate how shared savings and losses may encourage plans to use formulary design to control costs, we build on a hypothetical example from a prior MedPAC report. In a 2017 report, MedPAC [pdf] compares two hypothetical drugs that are close therapeutic substitutes: a branded drug with a list price of $12,000 and a 25% rebate versus a generic drug with a list price of $3,000 and no rebate. Under some simplifying assumptions (including that the enrollee only takes this one drug), MedPAC shows that the plan liability after rebates and reinsurance is actually $637 lower for the higher-cost branded drug. This difference is due in part to a Medicare reinsurance payment of $2,529 for the branded drug compared to no Medicare reinsurance payment for the generic drug. This may lead plans to only include the high-cost branded drug in their formulary and not the low-cost generic.
Under PDM, because plans would receive some of the reduction in Medicare reinsurance payment from the generic, they may choose to include the generic in their formulary rather than the branded drug. This would not only eliminate the Medicare reinsurance payment but also markedly reduce beneficiary cost-sharing. However, it is unclear how prevalent examples like this are in Part D.
Other tools
PDM’s other components give plans other tools to help curb Part D spending. Rewards and Incentives programs can encourage enrollees to switch to lower-cost generics or biosimilars. The more flexible MTM programs under PDM may encourage patients to adhere to their prescribed drug regimens. Medicare has tested similar MTM programs in another model. They found [pdf] that these more flexible programs led to spending reductions for hospital and skilled nursing facility services. However, these reductions were partially offset by increases in spending for outpatient services.
Finally, MA-PDs may have more tools than PDPs to lower Part D spending. Since MA-PDs cover physician and other services, MA-PDs may be able to encourage physicians (i.e., the drug prescribers) to prescribe lower-cost drugs.
Will it be enough?
In the middle of Part D's second decade, costs are spiraling. Facing exhaustion of the trust fund as early as 2024, Medicare is making important attempts at reform through models such as PDM. In the coming years, we’ll see to what extent these attempts will help.
Disclaimer: This piece was written by Fang He (Research Economist), Brett Lissenden (Research Economist), and Yan Tang (Research Economist) to share perspectives on a topic of interest. Expression of opinions within are those of the author or authors.


