Insights


Part 2 of our Practical Forecast Performance Evaluation series will explore an approach to evaluate the performance of flow forecasts when only limited data are available. For example, when we cannot assume that past flow forecast performance is a good indicator of future performance due to uncertainty caused by climate change, or when we have only minimal data on hand for evaluation. In such cases we suggest focusing on specific flow conditions of interest, or ‘events’, rather than on all flows.
To identify events, we mark a period of time when good forecasts are important in making operational decisions, we can define an event that occurs as the flow event and one that was forecasted as the forecast event.
In the example of high flows, a flow event starts when actual observed flow exceeds a threshold that would trigger a decision or action—an Action Threshold—and ends when the observed flow falls below the threshold. We typically start worrying about such a flow event happening when forecasted flows exceed a lower Watch Threshold and stop worrying when forecasts no longer predict flows that exceed the threshold. The time period between these forecasts is a forecast event. This is demonstrated in the figure below which displays two sets of flow forecasts (lines starting with a dot) against observed flows (dashed black line).
Forecast event 1 starts with the flow forecast A and ends with the forecast B. Forecast event 3 starts with the flow forecast C and ends with the forecast D. The flow events 2 and 3 describe the periods when the observed flows are above the Action Threshold. Note that no forecast event was triggered for flow event 2 – a false negative. And the flow event predicted during forecast event 1 did not materialize – a false positive. The flow and forecast events 3 overlap, which demonstrates a true positive.
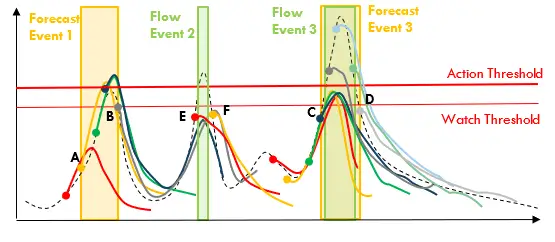
When we look back at our forecasts, these are the events that warrant assessing. Flows and forecasts at other times are not of interest to; if our main concern is high flows, they correctly did not trigger decisions—a true negative. We will inevitably end up with only a few events per year to assess—the topic of Part 3!
If you missed it, be sure to go back and read Part 1 in this series as an introduction.
Disclaimer: This piece was written by Michael Thiemann (Senior Water Resources Engineer and Data Systems Architect) and Katie van Werkhoven (Senior Water Resources Scientist) to share perspectives on a topic of interest. Expression of opinions within are those of the author or authors.


