Pandemic Metrics: Lessons Learned from Estimating Rt


During the COVID-19 pandemic, many stakeholders have used the effective reproduction number, Rt, as a real-time metric of epidemic growth. Although estimating Rt in real time is challenging, application of the latest methodologic techniques, attention to operational efficiencies (e.g., cloud computing resources), and careful presentation of results can overcome many of these challenges. We describe our experience and lessons learned generating Rt estimates in North Carolina to help inform other teams working to estimate Rt, and anyone interested in learning more about this ubiquitous pandemic metric.
The COVID-19 pandemic has generated an unprecedented demand for use of public health data for action. The decision makers working to mitigate the spread of SARS-CoV-2 (the virus that causes COVID-19) need high-quality metrics to inform decisions and track progress. However, this is easier said than done, because our understanding of the pandemic is evolving constantly and therefore always uncertain.
RTI International has been working to help public health and healthcare stakeholders manage this uncertainty by delivering real-time estimates of the effective reproduction number (Rt) for North Carolina.
The reproduction number, R, has become “a now-totemic figure in the COVID-19 pandemic.” Its simplest variant, R0, represents the number of people each person with SARS-CoV-2 will infect, assuming no one has immunity. Rt represents the number of people each person with SARS-CoV-2 at time t will infect, considering the control measures in place and the proportion of the population with immunity. Many governments have used Rt as a key indicator in monitoring the trajectory of the pandemic.
Anyone seeking to estimate Rt in real time will encounter a common set of technical and operational challenges. In this post, we review several of these challenges and the solutions our team used to overcome them.
To estimate Rt, analysts need to know the number of cases by infection date. However, for most COVID-19 cases, the precise date of infection is unknown. Instead, we know the number of cases by the date that a positive COVID-19 test was reported. For example, if you have a positive COVID-19 test today, you were likely infected with SARS-CoV-2 before today.
Calculating Rt directly from cases by report date would cause two problems. First, the estimates would be delayed, since reported cases are the result of infections that originated in the past. Second, the estimates would fail to account for the uncertainty of when those infections actually occurred. To transform cases by report date to cases by infection date, one must account for various forms of delay between infection and report date (e.g., generation time, incubation period, and reporting delay).[1]
Making these transformations from scratch would be time-consuming, but preexisting software packages make the solution easier. For example, our team used a publicly available R package, EpiNow2, which includes built-in distributions for different types of delay and ready-made functions to make the necessary adjustments to the data the user provides.
Generally speaking, it is not feasible to compute real-time Rt estimates on a personal computer. The complex methods necessary to transform cases by report date to cases by infection date demand too much computing power. This challenge is compounded when Rt estimates are needed for numerous geographic areas.
Our team used cloud computing to access the necessary computing power on demand. Cloud computing is powerful and flexible, but it adds a few hurdles of its own. If confidential data are used to generate Rt estimates, security measures and clearance may be necessary to upload the data to the cloud. There are also fees associated with cloud computing. Finally, more development time is needed to get things up and running.
The Centers for Disease Control and Prevention estimates that 1 in every 4.6 SARS-CoV-2 infections was reported in 2020. As testing availability and behavior evolve, the number and type of SARS-CoV-2 infections which are reported may also change over time. This can generate bias, which means that the reported cases may not represent the true population of people with COVID-19. For example, if it becomes easier to get a COVID-19 test, more people may get tested, which could result in an increase in reported cases without an increase in the true number of people with COVID-19.
Unfortunately, no easy solution exists for this problem. Sentinel surveillance and mass testing programs can provide additional insight, but these programs are difficult to implement and bring their own set of challenges. Other teams have adjusted reported case counts by testing volume, but this approach does not account for all the reasons testing behavior may change. Ultimately, the most important response to this challenge is to ensure that all stakeholders making decisions based on Rt estimates are aware of this limitation.
Many observers argue that some decision makers have misinterpreted Rt estimates during the pandemic. Analysts can help mitigate this by presenting Rt estimates in a way that helps users interpret them with caution. Our team found two steps especially crucial. First, we emphasized the uncertainty inherent in Rt estimates by showing a range of potential values (an interval estimate) instead of one value (a point estimate). This is particularly important when generating estimates for areas with few reported cases (e.g., an individual county) where the estimate may be highly uncertain. Figure 1 illustrates this dynamic.
Figure 1: Comparison of Point and Interval Estimates of Rt
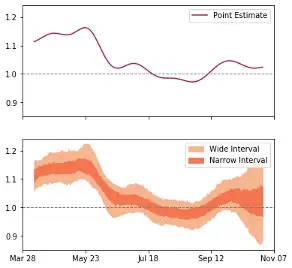
Figure 1: This comparison is based on publicly available reported COVID-19 case data from a North Carolina county from April-October 2020. Decision makers presented with the point estimate only might conclude that Rt is fairly stable around 1. However, Rt was beginning to increase at this time as part of the autumn surge in COVID-19.
Second, we presented Rt estimates alongside other important indicators. Rt is a useful metric, but it does not convey the entirety of the pandemic’s trajectory. For example, according to Covid Act Now, on January 29, 2021, California had the third lowest Rt (0.78) among 53 US states and territories. However, on the same date, California had among the highest daily new cases per 100k people and percentage of ICU capacity used.[2] Clearly, despite the low Rt, COVID-19 transmission was still a critical concern in the state at the time.
With a global vaccination campaign underway and new viral variants emerging, SARS-CoV-2 spread will continue to vary dramatically in the coming months. Stakeholders can use Rt estimates to monitor the pandemic and inform decisions. Unlike early in the pandemic, Rt estimates are now publicly available from a variety of sources. However, stakeholders may still have reasons to generate their own Rt estimates, such as needing estimates for additional geographic areas, using different data sources, and requiring customized output. We hope that the lessons we learned in developing our approach to estimate Rt will help others overcome some of these challenges.
The findings and conclusions in this publication are those of the authors and do not necessarily represent the views of the North Carolina Department of Health and Human Services, Division of Public Health or the Centers for Disease Control and Prevention (CDC).
Acknowledgments: We are grateful for the support and input from the RTI COVID-19 Modeling Team. This activity was based on a project originally developed through support from the CDC’s Modeling Infectious Disease in Healthcare (MInD-Healthcare) Network.
[1] Gostic et al. provide a thorough review of these concepts in detail.
[2] Daily new cases per 100k people: 56.6 (40th). Percentage of ICU capacity used: 89% (48th).