Insights


Gathering deep insights into communities from advanced data science methods and geospatial analytics
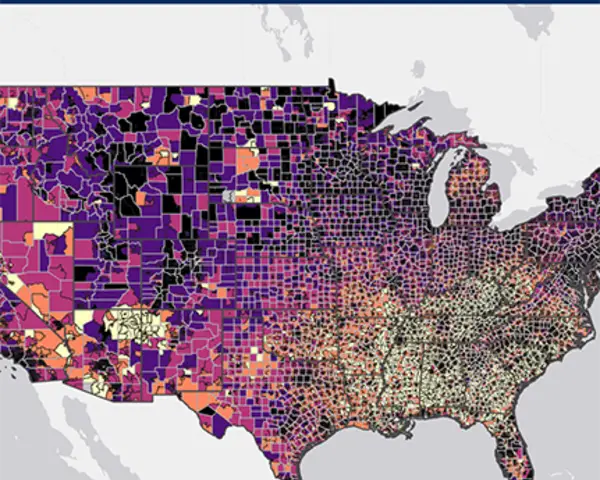
Public health officials at the federal and state levels have called for a better way to measure, predict, and adjust for social factors in health care and population health. The RTI Rarity project takes an “artificially intelligent” approach to inform decisions concerning community-level social, behavioral, environmental, and economic factors for quality health care. By curating a national database of more than 200 area-level measures within ten domains at the Census tract, ZIP code, and county levels across the U.S., the RTI Rarity tool provides high-resolution insights into factors that strongly influence health outcomes.
The RTI Rarity tool uses supervised machine learning, including random forests and other state-of-the-art predictive methods, to create LSI scores drawing on the various measures. The analysis tool and its underlying data allow for the development of both within-state and cross-state summary scores and ten domain-specific sub scores informed by our conceptual framework. The scores yield meaningful insights into the neighborhood-level factors driving local health outcomes.
The Impact of LSI Scores
The RTI Rarity LSI scores have been benchmarked against three existing area-based composite measures: the Area Deprivation Index (ADI), the Social Deprivation Index (SDI), and the Social Vulnerability Index (SVI). In terms of life expectancy at birth, the LSI leads in explaining 67% of the variance across the US, whereas the SVI only explains 26%, the SDI explains 29%, and the ADI explains 43%. In other words, the LSI measure accounts for substantially more of the differences between the neighborhoods with the highest and lowest life expectancies across the U.S.
The RTI Rarity LSI scores can also be linked with individual-level data to improve predictions of individual outcomes. In population-based analyses, these scores can be used to:
- understand the impact of health care innovations, payment models, and interventions in high-risk communities;
- identify neighborhoods and areas at highest risk of poor outcomes for better targeting of interventions and resources;
- account for factors outside of providers’ control for more fair performance/quality measurement and reimbursement.
Improving Health Outcomes via RTI Rarity LSI Scores
With the data LSI scores provide, organizations can draw insights to inform factors that can strongly influence and improve health outcomes. The RTI Rarity project merges AI and data science in a risk adjustment framework with high-resolution data. We aim to provide the local context that will enable researchers, policy makers, and health care systems to better account for, and address, health care concerns across the life course.
The RTI Rarity Dashboard
Explore all four of our current risk scores—including, Life Expectancy (LSI-LE) scores, cancer mortality (LSI-Ca) scores, drug overdose (LSI-DO) scores, and sexual and reproductive health (LSI-SRH) scores—along with other information such as the locations of Title X family planning clinics and substance use recovery resources.
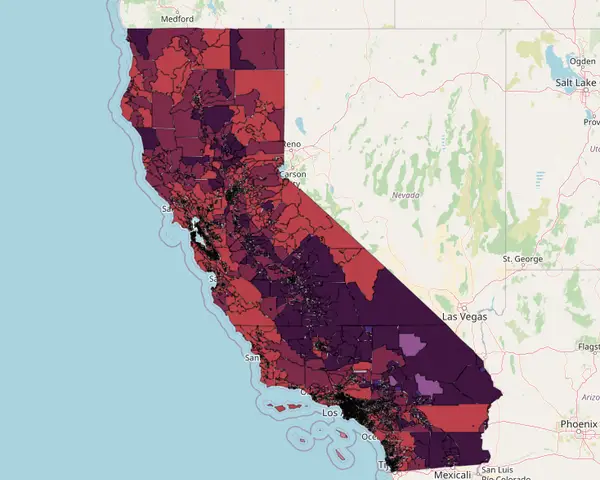
NEW: Local Climate Impact (LCI) Score
A groundbreaking pilot project in California and Florida was the first to use the Local Climate Impact (LCI) score. The project aims to model and visualize the localized impacts of adverse climate events using a comprehensive and interactive dashboard. This innovative tool highlights community-specific scores on climate risk, resilience, and vulnerability. The model incorporates 109 measures of vulnerability at the Census tract level. An additional 55+ variables comprise the resilience domain, and 18 measures are used to define climate risk, offering a granular and comprehensive picture of potential impacts of a wide range of climate-related events.
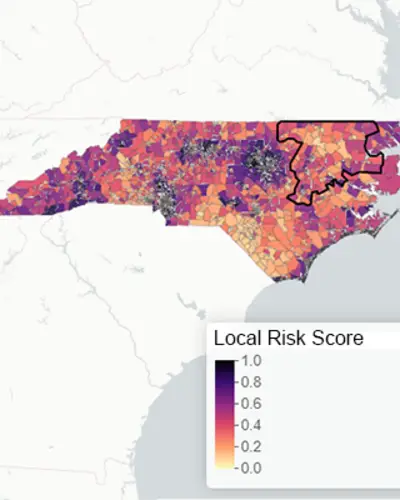
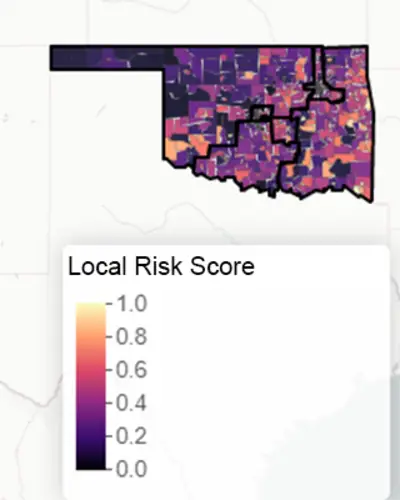
Interactive Maps: State LSI Scores
View the RTI Rarity LSI scores at the tract level for select states.
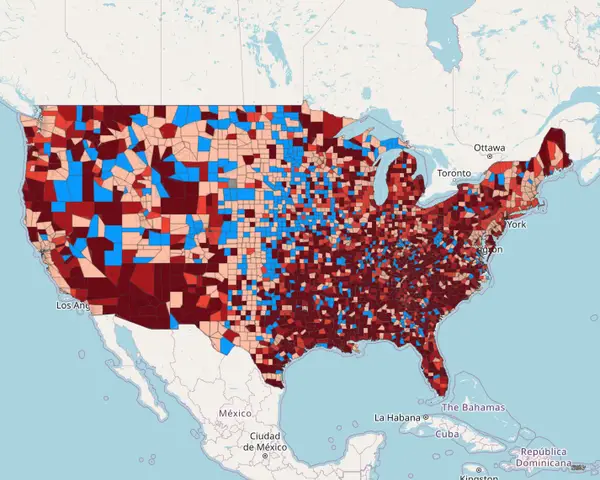
LSI-C19 Dashboard: COVID-19 Excess Mortality Analysis
The COVID-19 pandemic has had a profound and disproportionate impact on some neighborhoods in the United States. Our research team aimed to apply data science and machine-learning methods to understand social, political, clinical, and epidemiological drivers of excess mortality during the COVID-19 pandemic at the neighborhood level, which we defined as the Census tract.
The RTI Rarity Tool on the Healthy Intersections Podcast (HIP)
HIP, August 2024 | Local Climate Impact
In this episode, hosted by Dr. Lisa M. Lines, the RTI Rarity team unveiled a groundbreaking pilot project: the Local Climate Impact (LCI) score. The project, piloted in California and Florida, aims to model and visualize the localized impacts of climate-related events using a comprehensive and interactive dashboard that highlights community-specific scores on climate risk, resilience, and vulnerability. (This podcast was originally published on The Medical Care Blog.)

HIP, June 2024 | Alzheimer’s Disease & Related Dementias
This episode recognizes Alzheimer’s Awareness Month with a round-table discussion between Dr. Jazmyne McNeese from PolicyMap and RTI’s Dr. Lisa Lines, Chloe McGlynn, Dr. Vicki Johnson-Lawrence. The discussion shares ideas for improving access to care and shows how prevalence, and some of the top predictors, are distributed across the U.S. (This podcast was originally published on The Medical Care Blog.)
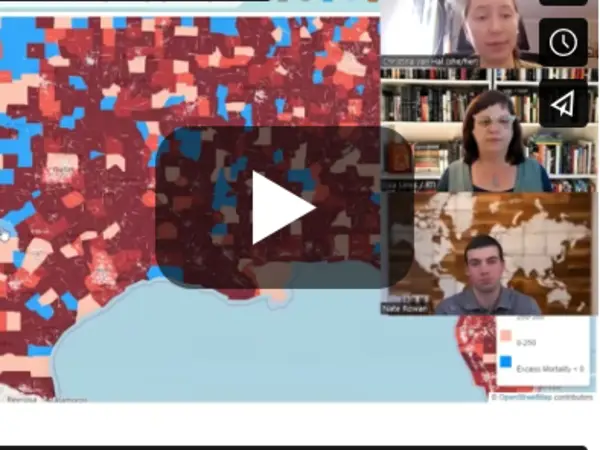
HIP, March 2024 | COVID-19, 4 Years Later
In this episode of HIP, Dr. Lisa M. Lines and the RTI Rarity team discussed their newest LSI score focused on excess mortality from 2020-2022. See how the latest interactive dashboard, which focuses on the new LSI score for COVID-19, can be used to identify social, political, clinical, and epidemiological drivers of excess mortality during the COVID-19 pandemic. (This podcast was originally published on The Medical Care Blog.)
HIP, August 2023 | The Drug Overdose Epidemic
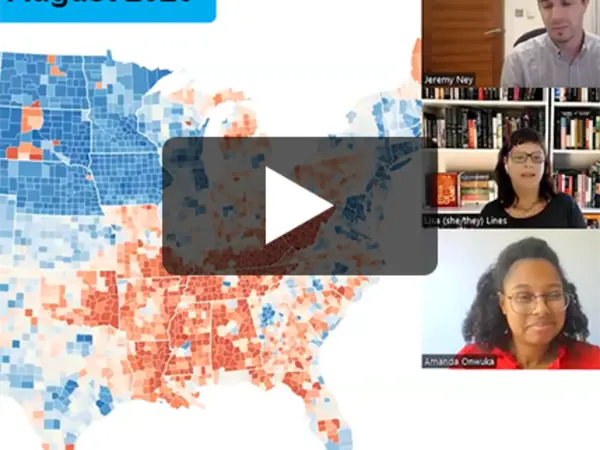
In this episode of HIP, Dr. Lisa Lines, Dr. Amanda Onwuka from RTI International, and author Jeremy Ney, talk about mental health, opioid prescribing rates, and multi-level interventions to prevent addiction and overdose. (This podcast was originally published on The Medical Care Blog.)
HIP, July 2023 | RTI Rarity Interactive State Map: Florida
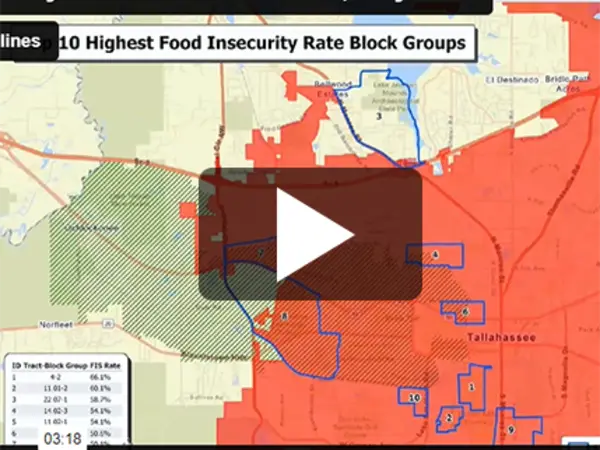
In this episode of HIP, Dr. Lisa Lines and Lauren Pierce, a public health consultant who previously worked with the Florida Department of Health for 15 years, use the RTI Rarity tool to look at LSI in Life Expectancy scores for Leon County, FL, where the state capitol, Tallahassee, is located. (This podcast was originally published on The Medical Care Blog.)

HIP, May 2023 | RTI Rarity Interactive State Map: Oklahoma
On this episode of HIP, Dr. Carol Schmitt and Dr. Lisa Lines look at the Rarity interactive map for Oklahoma to discuss how LSI scores for specific communities, including tribal nations, compare to larger state averages to highlight the importance of these county-level data. (This podcast was originally published on The Medical Care Blog.)
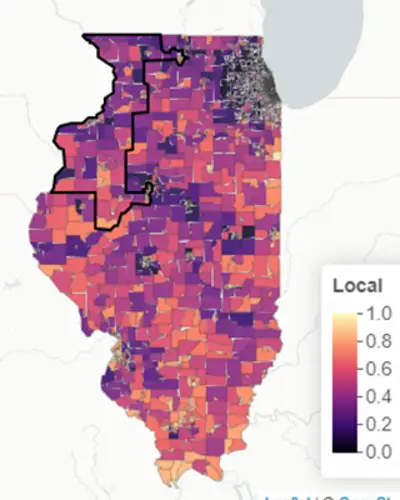
HIP, April 2023 | RTI Rarity Interactive State Map: Illinois
The April episode of HIP, sponsored by the American Public Health Association’s Medical Care Section and hosted on The Medical Care Blog, discusses the LSI and life expectance (LSI-LE) scores of several areas in Illinois based on the interactive Rarity map with experts Dr. Carol Schmitt and Dr. Lisa Lines.
ASTHO Podcast Interview: Ep 209: New Tool Predicts PH Risks, featuring Dr. Lisa Lines
Dr. Lisa Lines joins the Association of State and Territorial Health Officials (ASTHO) Public Health Review Morning Edition podcast to discuss how the RTI Rarity tool can help public health leaders measure, predict, and respond to social factors that impact population health.

goRED Talk, featuring Dr. Stephanie Hawkins
The American Heart Association's goRED Talks help educate, entertain, and inspire women to take action and prioritize their heart health. View Dr. Stephanie Hawkins' presentation during the goRED Talk, where she uses RTI Rarity data to understand and visualize her personal experience with access to health care.


Contact us using the form below to learn more about the RTI Rarity tool and how you can access insights to improve health outcomes.
Disclaimer: This piece was written by Lisa M. Lines (Senior Health Services Researcher) to share perspectives on a topic of interest. Expression of opinions within are those of the author or authors.