Background
Starting in 2018, RTI International bought and deployed hundreds of low-cost air quality sensors (PurpleAir PA-II sensors) as part of an air quality citizen science project funded by the National Aeronautics and Space Administration (NASA) (Mills et al., 2019). RTI distributed the PA-II sensors to citizen scientists in Los Angeles, California; Raleigh, North Carolina; and Delhi, India, to be deployed as part of an outdoor low-cost sensor network to capture and understand the spatial gradients and temporal variations in fine particle (PM2.5) concentrations in each region. Additionally, one of the study goals was to relate spatial gradients in satellite-based aerosol optical depth observations to PM2.5 spatial gradients at the ground level. As a result, tentative sensor locations chosen to address these goals did not necessarily always fall within urban regions but included remote and rural regions. The PA-II sensor requires power, which is typically provided by a standard power outlet, and wireless internet (Wi-Fi) for real-time data transmission to the PurpleAir server. The team determined early on that many key locations in this network were likely in areas of unreliable power and Wi-Fi and may need backup power and satellite data connection. Therefore, RTI designed a solar power and Wi-Fi station for use at these locations from the perspective of a citizen scientist being able to build and install one on their own using commercially available parts.
Although we initially expected that the stations in rural India would need a solar station, citizen scientists and in-country collaborators were able to find locations with a power supply. As our team discussed installing sensors at schools in North Carolina, we quickly learned that external power outlets can be rare at grade schools. Even at grade schools with external outlets, often the outlets are in locations unsuitable for deployment of an air quality sensor. Therefore, these solar stations became valuable during sensor deployment at US schools. Here, we describe the design and construction of the solar station documenting our case study, along with our findings and recommendations resulting from this process.
Methods
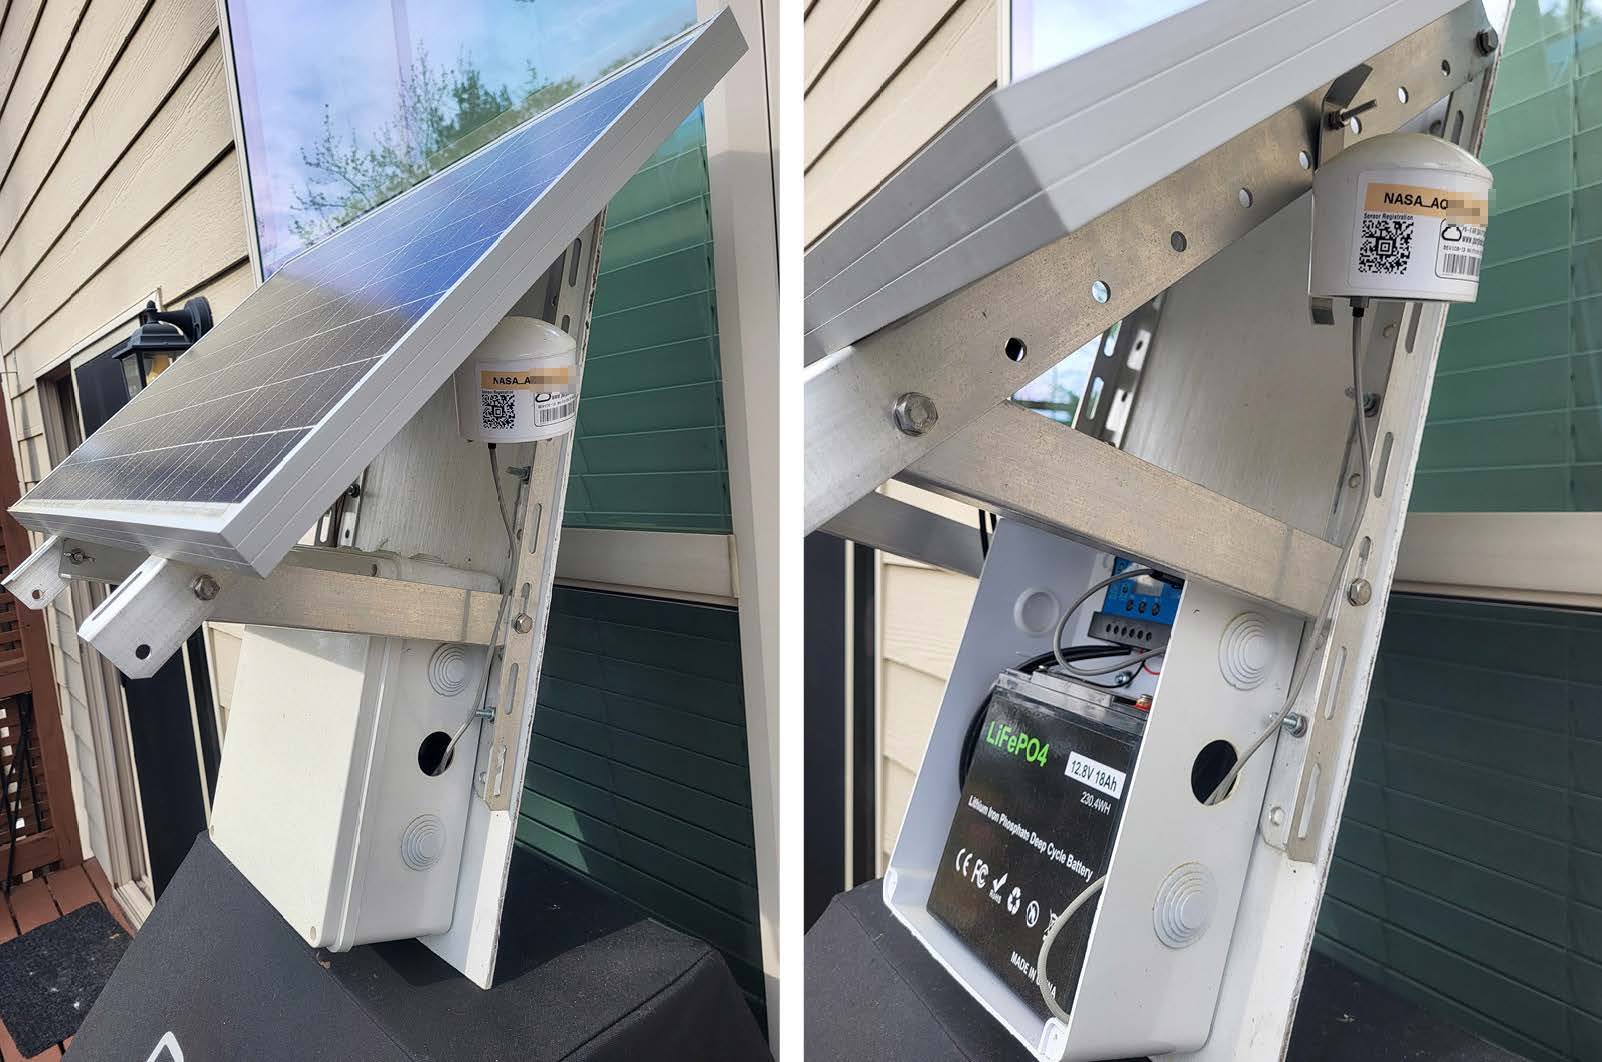
An initial design for the station used a waterproof case to both hold electrical parts and be a foundation for the custom-made solar panel mounting bracket (Figure 1, referred to as the “prototype design”). However, we later determined that a less-expensive design using a smaller case and an off-the-shelf solar panel mounting bracket worked better for the application (Figure 2, referred to as the “secondary design”).
Figure 1.
167003Solar station design used in RTI’s initial testing and deployment with the panel mounted to the waterproof box (prototype design)
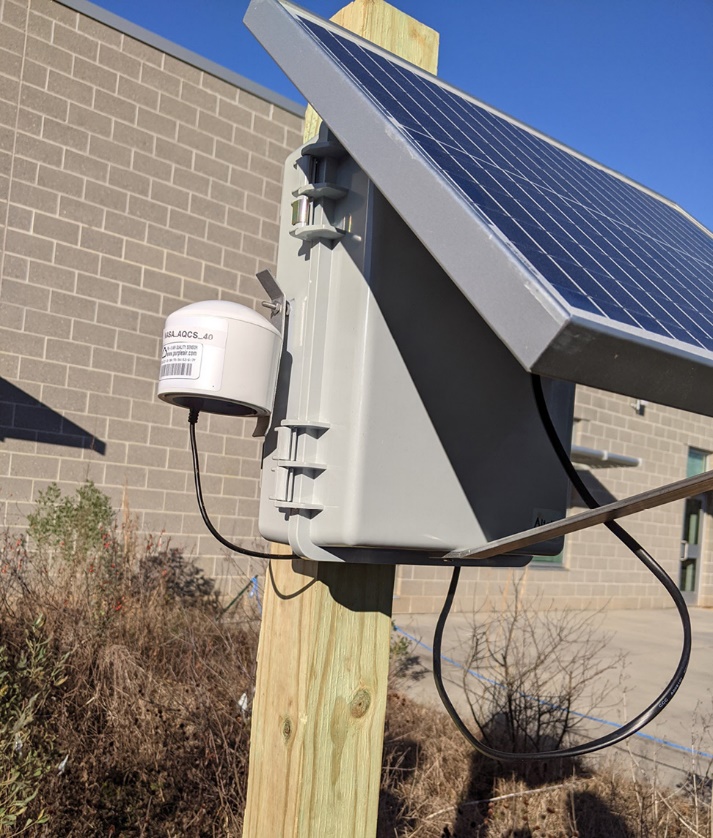
Figure 2.
167004Solar station designs used in RTI’s initial testing and deployment with the panel mounted on a backer board (secondary design)
Notes: (A) The secondary station design used a backer board to hold the solar panel bracket and waterproof box. (B) The PurpleAir sensor was mounted on a stainless-steel screw in the middle of the panel bracket, and the controller and battery were housed in the waterproof box. The station on the backer board could be mounted to a wall or pole. In these photos, the solar station leans against a wall before installation.
Five locations have used the secondary design of Figure 2 to successfully power low-cost air quality sensors. The manufacturer of the PurpleAir sensor has not posted recommendations on their website for where to install a PurpleAir sensor outdoors. However, in the experience of this project team, it is ideal to install the solar station facing south and away from a tree line or tall buildings that would otherwise interrupt the station’s maximum access to the sun. To best assess the air quality at human exposure levels, the station should be mounted 5–6 feet above the ground.
The basic components of a solar power system include a solar panel, battery, and controller. The solar power system harvests power from the solar panel and stores it in the battery for later use by other devices. Table 1 lists the general components for a solar station to power a low-cost sensor (e.g., PurpleAir PA-II). We designed the stations in this project to remain stationary on a wall, pole, or post. Therefore, the station components include a backer board, made of plywood, to hold all other components. However, adopters of this method could orient the components differently. To protect the controller and battery, a waterproof box is also used in this method. Different-sized boxes can be used. If the user needs a Wi-Fi hotspot in their station, for example, a larger box may be the right choice. Figure 3 shows a schematic of the circuit connection sequence.
Table 1.
167005Basic list of solar station parts, base requirements, and optional additions
Notes: We have included our final station choices. However, your station may need to be different, depending on your sensor installation site.
a Solar panel and battery requirements will vary by desired application. The provided details for the solar panel and rechargeable battery are for the prototype and final solar station system presented in the particular use case of this study.
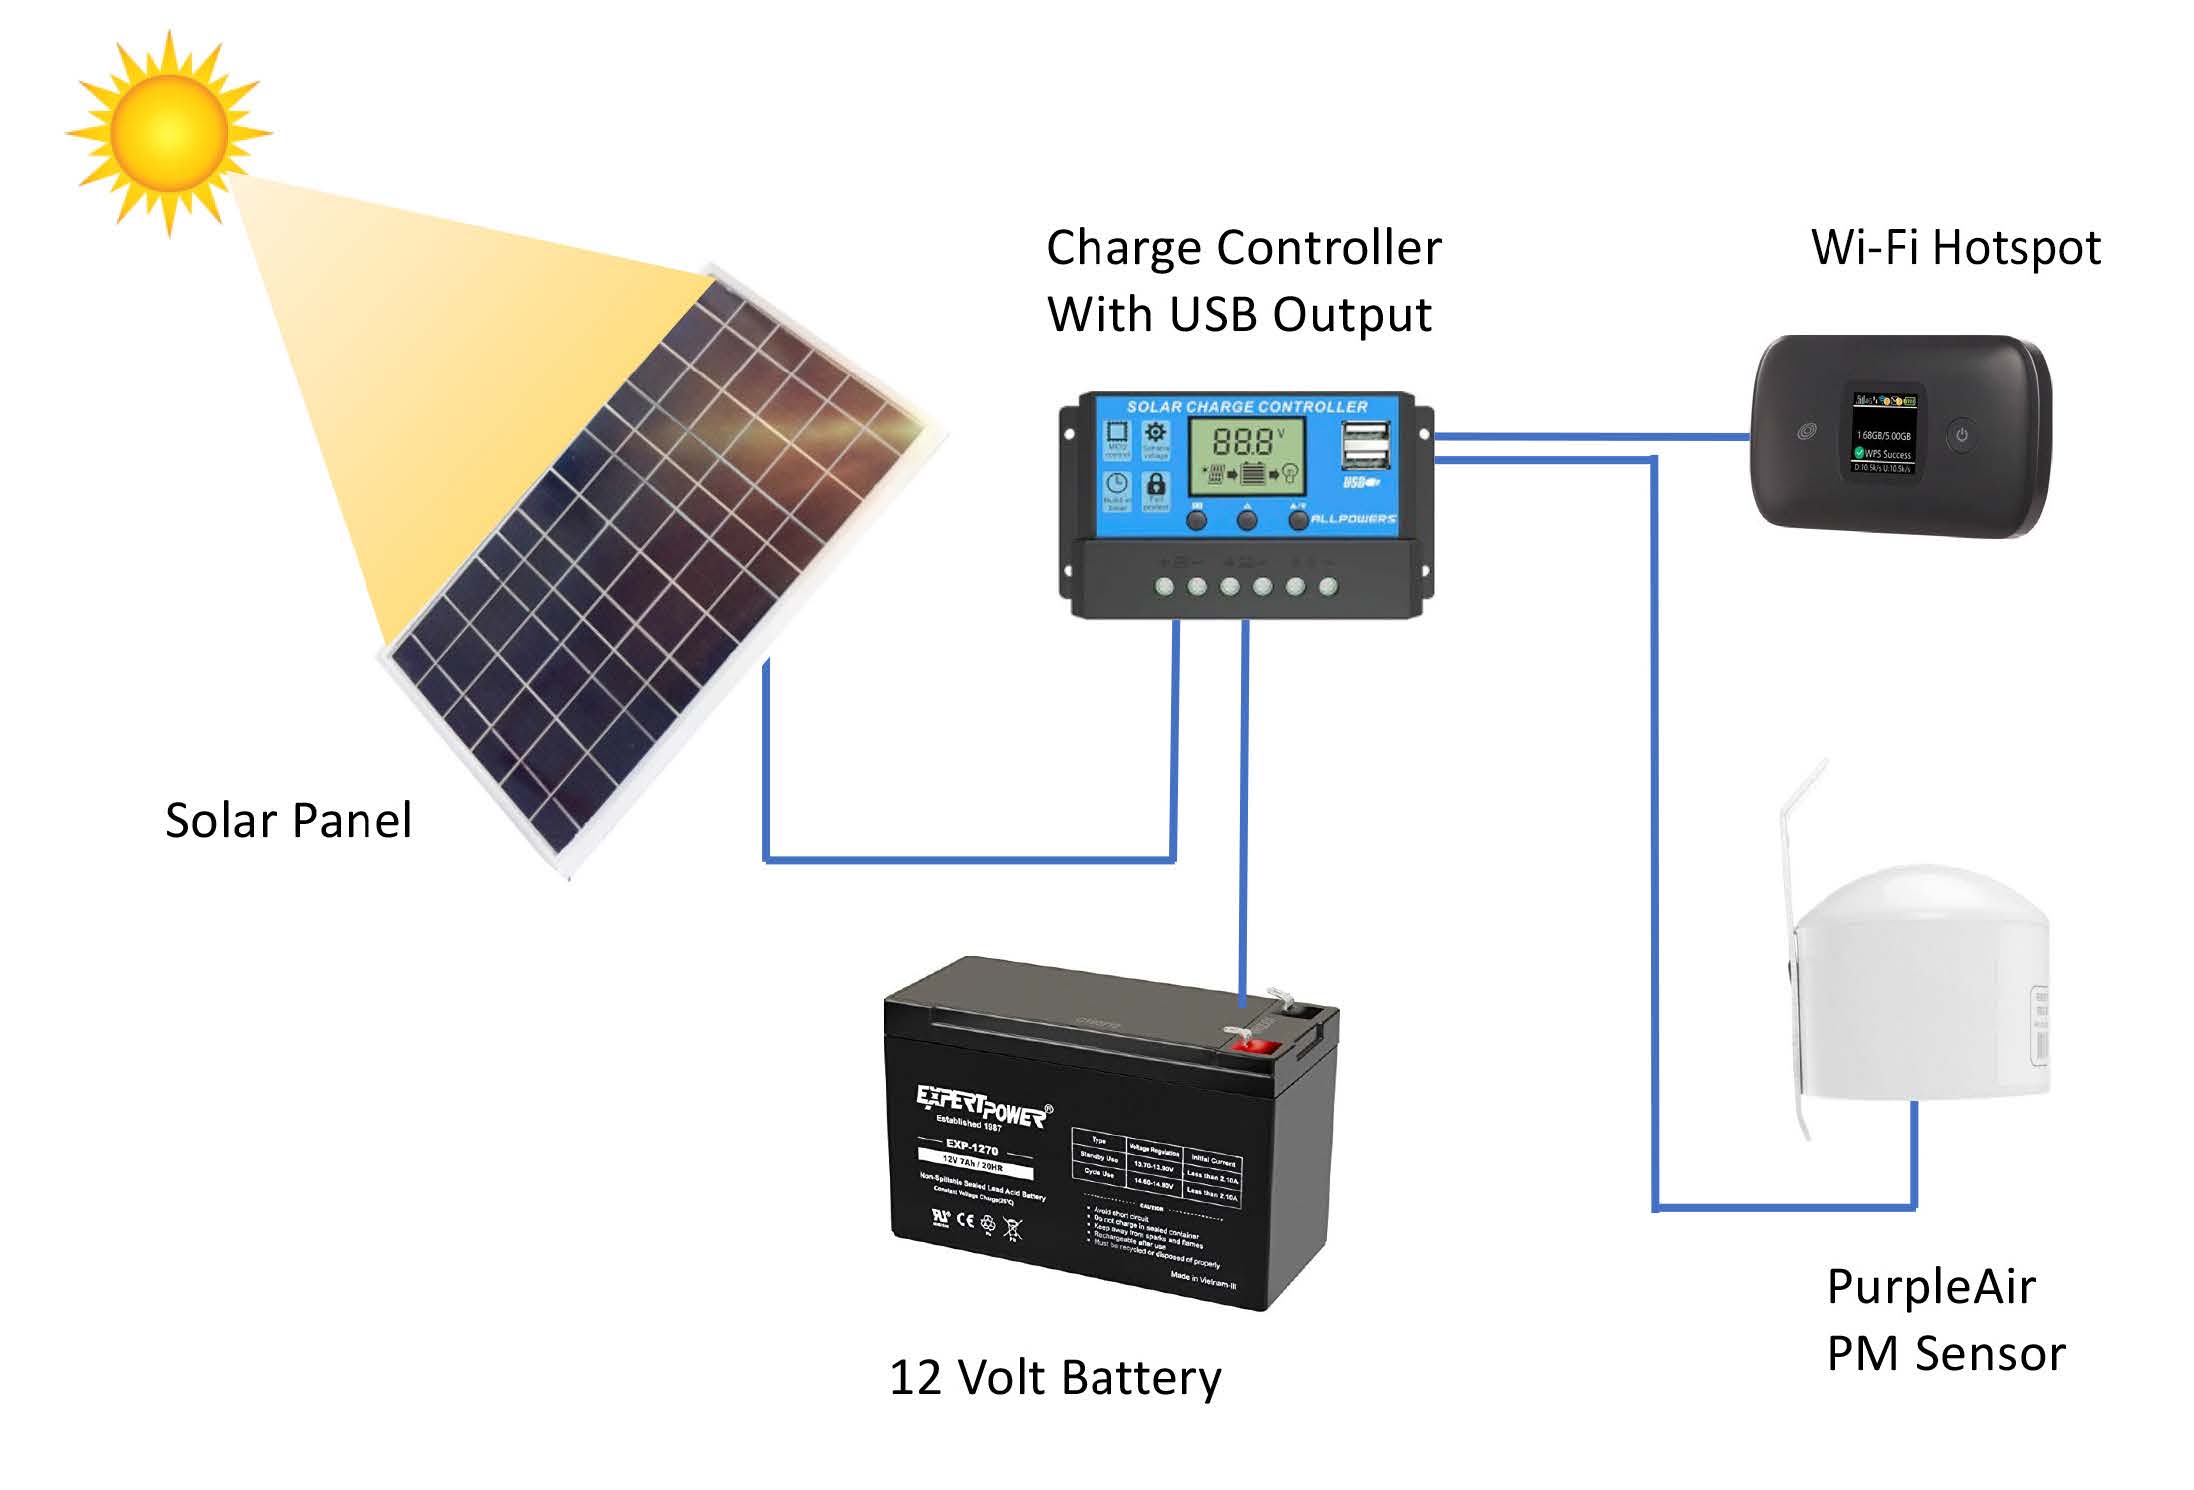
As shown in Figure 3, the micro-USB to USB cord connects the PA-II sensor with the solar charge controller. The charge controller is the central component through which all electrical connections are routed. The solar panel is connected to the controller. The charge controller manages the charging and discharging of the battery according to power input from solar panel and power draw of the devices connected to it (i.e., PA-II sensor, Wi-Fi hotspot). The PA-II sensor is mounted using screws or zip ties. In the configuration shown in Figure 1, the sensor is mounted directly onto the weatherproof box with a screw. In Figure 2, the sensor is again mounted using a screw, but this time to the solar panel bracket. A short USB cable reaches from the controller through a port in the box and out to the sensor.
The size (i.e., power requirements) of the solar panel and the rechargeable lead-acid battery shown in Table 1 are based on the power requirements of the entire solar station for our study. Each project or solar station designer will need to determine what power-drawing devices will be connected to the panel/battery, the anticipated power draw by each device, and whether the devices need to run continuously. In our case, at a minimum, the solar station would need to supply power to the PurpleAir PA-II sensor and the solar charge controller, if an independent Wi-Fi is source is available. The PurpleAir PA-II sensor requires 0.18 A continuous direct current (dc) at 5 volts (Vdc), and the solar charge controller requires 0.01 A at 12 Vdc. If there is no reliable Wi-Fi from nearby buildings, the solar station would also need to supply power (in watts [W]) to a cellular phone or other device that supports hotspot service. Table 2 shows these requirements.
Table 2.
167007Power consumption of the devices in the prototype solar station system
| Device | Watts (W) |
|---|---|
| PurpleAir PA-II | 0.9 |
| Solar charge controller | 0.12 |
| Cell phone (charging) | 15a |
| Cell phone (plugged in, standby) | 0.5b |
a The power to charge a cell phone varies by manufacturer and model. This value represents a Motorola Moto g5 cell phone with a 2,800 mAh (milli amp hour) battery and fast-charging capability (3 A at 5 Vdc).
b Average standby energy consumed by a cell phone varies by manufacturer and model. This value is the average value determined by Lawrence Berkeley National Laboratory (2022).
For the prototype solar station, the target end users were elementary schools in North Carolina. These elementary schools had access to Wi-Fi but did not have access to outdoor electrical outlets. Therefore, we designed the prototype station to supply power to only a PurpleAir PA-II sensor and the solar charge controller (~1.02 W or 24.5 watt hours [Wh] per day). We assumed that having a battery power the system for 2 days without recharging may be sufficient (i.e., the battery should supply 24.5*2 = 49 Wh) for typical conditions in North Carolina. Given that a lead-acid battery should be discharged to no lower than 50 percent to maintain a reasonable life expectancy, the capacity requirement of the battery can be determined by doubling the anticipated total power requirement. The capacity of the battery needed, in Wh, would therefore be approximately 98 Wh. As outlined in Table 1, the prototype design used a slightly smaller 12 V, 7 amp hour (Ah) lead-acid battery (84 Wh).
The other key consideration for the prototype design was the solar panel power. Solar panels need peak (i.e., direct) sunlight to perform at their maximum rated output power. The solar station system described here uses a flat solar panel on a tilt that does not track the sun in the sky. In the state of North Carolina, this type of system gets an average of 7 hours of daylight per day, but only 4.7 of these hours are considered peak sunlight (i.e., provide 1000 W/m2 in an hour; National Renewable Energy Laboratory, 2022). The prototype design aimed to choose a solar panel that could fully recharge the lead-acid battery (84 Wh) in 1 day within the peak sunlight hours. With an estimated 4.7 peak sunlight hours, a 20 W solar panel would therefore provide 94 Wh per day (20 W * 4.7 hours), implying that the 84 Wh battery would be fully charged in a day under the specified conditions. Lower hours of peak sunlight would mean that the battery may not reach a fully charged state.
Results
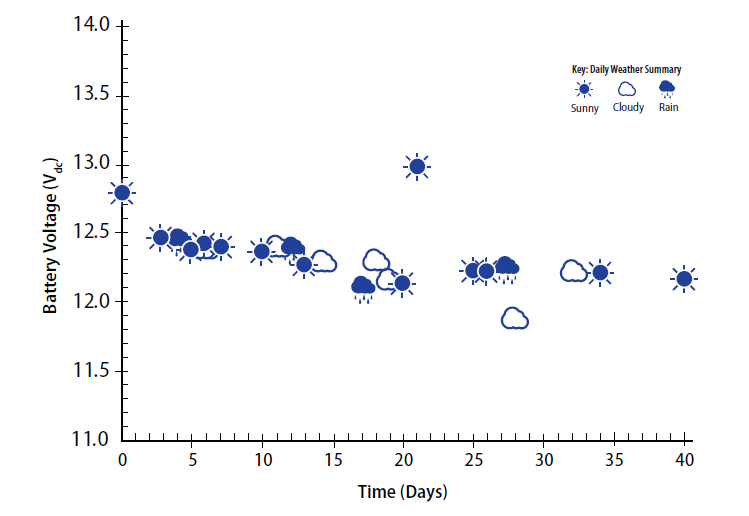
We conducted the first field test of the 20 W solar panel and 7 Ah lead-acid battery design in August and September over 40 days. During this testing, the station was mounted to a light pole at one of RTI’s parking lots and away from the nearest tree line. The panel was mounted facing southwest, where it would receive at least 8 hours of sun on a clear day. We monitored the functionality of the prototype solar station in two ways: we monitored the voltage of the battery to ensure that it remained within specifications of the solar charge controller, and we checked the red LED status light of the PurpleAir PA-II sensor to verify that the PurpleAir PA-II sensor was receiving power. During this test, the PurpleAir PA-II sensor was not connected to Wi-Fi to upload data to the cloud. Throughout the 40 days, there were several cloudy days back-to-back and several days of heavy rain because of a passing hurricane. Throughout the test, the battery’s Vdc remained above 11.9 V, as shown in Figure 4. The solar charge controller experienced a drop in voltage to 7.69 V during the hurricane but otherwise remained between 12.47 V and 17.0 V. The PurpleAir sensor was always observed to be properly powered by the station. We concluded that the first field test was successful and that the solar station should be able to support a sensor-only configuration with independent Wi-Fi access.
Figure 4.
167008First field test
Note: During the first field test, we monitored the battery voltage (Vdc) as it successfully supplied power to the PurpleAir PA-II sensor and solar charge controller for almost 6 weeks through sunny, cloudy, and rainy days.
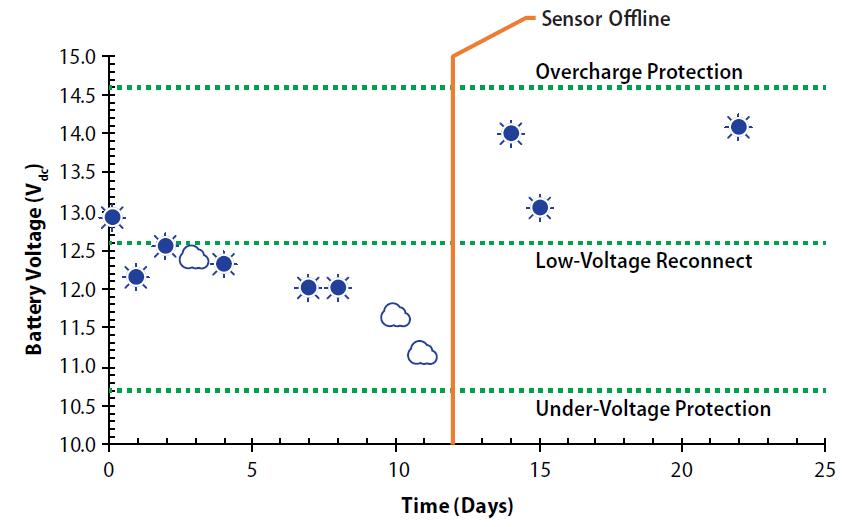
We conducted the second field test in November over a 3-week period. The second field test had two aims: demonstrate that the solar station system can power a cell phone to provide Wi-Fi for the PurpleAir PA-II sensor, and monitor the system during a loss-of-power event. The second field test also used the same combination of the 12 V, 7 Ah (i.e., 84 Wh) lead-acid battery and the 20 W solar panel. From the power requirements noted in Table 2, we estimated that the cell phone, sensor, and solar charge controller require a total of 3.32 W (or 79.7 Wh per day), assuming we start with a fully charged cell phone. Thus, with a 3.32 W power draw, it is essential that the 84Wh battery be fully recharged each day for uninterrupted operation. With this system, we knew the battery would likely not fully recharge on cloudy or rainy days, and it was also likely that the sensor would go offline, which would help us troubleshoot loss-of-power situations.
Figure 5 shows the Vdc of the battery and weather conditions on select days throughout a 3-week test period. The battery Vdc remained between 10.7 V and 14.6 V, indicating that the solar charge controller was operating within its voltage limitations. However, the sensor went offline on day 11 after two cloudy days. On day 14, the sensor’s red power light was on, but it was not transmitting data over Wi-Fi. We hypothesized that the sensor was shut off by the solar charge controller when the voltage dipped below 10.7 V (not recorded). After the battery recharged past 12.6 V, the PurpleAir sensor was powered back on but failed to reconnect to Wi-Fi. It appears that once the sensor loses power and access to Wi-Fi, it does not reconnect automatically to Wi-Fi upon return of power and requires a manual reset. The second field test demonstrated the following: (1) feasibility of connecting a cell phone to provide Wi-Fi; (2) sensor response and behavior during a power loss event; (3) the importance of choosing the right design configuration of battery and panel based on system needs, if uninterrupted operation is key; and (4) the need for a manual reset of this particular sensor after power loss.
Figure 5.
167009Second field test
Note: The second field test, in which a cell phone was used to provide a hot spot for Wi-Fi, showed that the sensor went offline within 11 days.
Because the first field test was successful and mimicked the conditions needed at elementary schools, we deployed several solar station systems at local North Carolina elementary schools. We asked school representatives to install the solar station in an area that would maximize sunlight but also be close enough to reach the school’s Wi-Fi. The sensors at three stations we distributed, in early August of the following year, went offline a few days after installation. As a first troubleshooting step, we increased the battery sizes at each station to 12 Ah. Increasing the battery size to 12 Ah would provide approximately 72 Wh of useable energy (i.e., half of the battery’s capacity of 144 Wh) for the solar station system. Because these systems did not need to power a cell phone for Wi-Fi, we still estimated the energy consumption at the schools to only be 24.5 Wh per day. The increased battery capacity should have provided nearly 3 full days of charge to the solar station system without any recharging. However, after a few weeks, each sensor went offline, ranging from 17 days operational to 59 days operational. We suspect that the sensor power draw may have been higher than the nominal rated draw during periods of weak Wi-Fi signal. This indicated that a larger battery alone was not sufficient and drove us to reexamine the field tests conducted and the findings.
From our first field test and the deployed elementary school solar station systems, it became clear that we needed to reexamine the relationship between actual sun exposure, necessary “rainy day” operation, good battery health maintenance, and the solar panel’s ability to recharge the battery at a sufficient rate to keep up with the power draw.
Although a 1 Ah battery could provide 1 A for 1 hour, discharging a lead-acid battery past 50 percent would damage the battery. Therefore, a controller is used to protect the battery. We used a solar charge controller with its default settings for the prototype: discharge stop = 10.7 V, discharge reconnect = 12.6 V, float charge = 13.6 V. With these settings, the PurpleAir PA-II sensor would stop drawing power from the battery (i.e., it would turn off) if the voltage of the battery went below 10.7 V. The sensor would then reconnect when the voltage of the battery went above 12.6 V. The float charge represents the voltage to protect the battery from overcharging (i.e., the battery will stop accepting charge from the solar panel once it reaches 13.6 V). After prototype testing, some of the batteries had become damaged, so we raised the discharge stop voltage to 12.2 V (which corresponds to a discharge of approximately 60 percent).
With the additional capacity of the 12 Ah battery, we were hopeful that the solar station system would operate continuously. One possible limitation of increasing the capacity of the battery was that even though the solar station system would last longer during inclement weather, it would also take longer to fully charge because of its larger capacity. We expected our battery to discharge in about 72 hours and charge in about 10 hours (limited by Imp = 1.16 A of our original 20 W solar panel) (MIT Electric Vehicle Team, 2008). We did not expect this to be a problem given the typical number of peak sunlight hours in North Carolina. However, we learned that installing close enough to a building for Wi-Fi signal naturally put the building in a place that hindered the station receiving sunlight. Therefore, the 20 W solar panel was unable to fully recharge the 12 Ah battery in the limited sunlight available.
Second Design Selection
To charge the batteries faster, we inspected both the solar charge controller and the solar panel. The selected solar charge controller allowed a charge current up to 20 A, but the solar panel was only capable of delivering Imp = 1.16 A. Therefore, a larger solar panel was purchased (50 W) that more than doubled the current to Imp = 2.53 A. With this solar panel, the charge time of the 12 Ah battery could be lowered to about 5 hrs. At this time, we also decided to switch to a lithium-ion battery because these batteries can be fully discharged without damage to the battery and have a smaller profile than lead-acid batteries (and therefore fit in our waterproof electronic case easier). After switching to a 50 W panel and an 18 Ah lithium-ion battery, this station design ran continuously for the near-building application.
Discussion
From our deployment of the solar station system to North Carolina schools and subsequent modifications to our prototype system, we make the following recommendations for future solar station system designs:
Solar station placement: The solar panel must be facing southeast with as much exposure to sun as possible. Sunlight peak hours should be considered, as these will decrease during the winter, and adjustments to battery and solar panel sizes should be made with consideration of the least amount of sunlight that the solar panel will experience.
Rechargeable battery: In general, 12 V lead-acid and lithium-ion batteries should not be charged faster than 4 hours. Charging times between 6 and 8 hours are more common to preserve battery life. Because peak sunlight hours in many locations around the world are less than 6 hours per day, it is advised that the capacity and type of the battery be chosen to account for weather variability. At a minimum, battery capacity should be chosen such that the battery is only discharged to 50 percent after 3 days, but longer discharge rates (e.g., 7 days, a month) may be needed by location. When deciding between types of batteries, some factors to consider are that lead-acid batteries are cheaper upfront, but lithium-ion batteries are more efficient and have a smaller profile. In addition, lead-acid batteries (except deep-cycle) can only be discharged to 50–60 percent, but lithium-ion batteries can be fully discharged without harming the battery.
Solar panel recharge rate: Imp must be large enough to charge the battery in 5 to 6 hrs.
Solar charge controller: The solar charge controller must be able to support the Imp of the solar panel. For a lead-acid battery, the discharge voltage should be adjusted to the expected voltage for 60 percent discharge of the rechargeable battery (i.e., 12.2 V). For a lithium-ion battery, the discharge voltage should be adjusted as specified by the manufacturer (in this paper, we used 12.2 V).
Using these general recommendations, we outline a few hypothetical cases in Table 3. For the specific-use cases, examples 1 and 2, we provide recommendations for hypothetical locations with low (3.5 hours) and high (5.5 hours) average peak sunlight hours per day (denoted LOW and HIGH in Table 3). We chose these average peak sunlight hours because they are observed in Maine and Arizona, respectively (National Renewable Energy Laboratory, 2022). Load 1 is always the PurpleAir PA-II sensor and solar charge controller, which have a combined power consumption of 1.02 W. Load 2 is optional but might include a cell phone or hotspot to provide Wi-Fi for the PurpleAir PA-II sensor when Wi-Fi from a building is unavailable. Load 2 power consumption in Table 3 is only representative of the charging power needed and does not represent standby power draw. For a cell phone, charging power is near 3.68 W, standby power (i.e., the device is already charged) is near 0.5 W, and the cell phone power supply consumes 0.26 W. Because the average standby power consumption of a fully charged cell phone is 13.5 percent of the charging power, it could be advantageous to use a USB switch to control the power delivered to the cell phone or hotspot (see Table 1). For the values derived in Table 3, we assumed that a USB switch or other switch is used to only supply power to the cell phone or hotspot for 3 hours each day (the average time to charge a cell phone is only 2 hours, but a conservative estimate was used). The USB switch is not included as a separate load in Table 3, but it does consume power (more details below).
Table 3.
167010Recommended minimum battery and solar panel sizes for different use cases of the solar station system
a Load 1 is always the PurpleAir PA-II sensor and solar charge controller, which has a combined power of 1.02 W.
b The total load represented here is based on the energy needed to charge a cell phone; we used an estimation of 3.68 W, but actual numbers will vary by product.
The battery and solar panel sizes in Table 3 can be derived from the sum of the total energy consumption of the individual components. The total energy consumption in the LOW situation of Example 2 of Table 3 is in Table 4 (load 3 is the USB switch). We calculated the total energy consumption for 6 days to allow for inclement weather and low peak sunlight expected. We then calculated the capacity of the needed lithium-ion battery (in Ah) by dividing the needed power (i.e., 250 W) by 12 V: 250 W/12 V = 20.9 Ah. Finally, we chose the solar panel so that Imp can charge the battery in 5 hours: 20 Ah/5 h = 4 A. For the HIGH scenarios, the location of the solar station is where peak sunlight hours per day are much longer and extended periods of inclement weather/cloud coverage may be relatively less common. For this sunnier scenario, it is only necessary to have a battery that can operate the system for 2 days without charging, and you might only need a lead-acid battery. However, the values calculated in Table 3 are conservative estimates for the HIGH use cases and assume a lithium-ion battery and 4-day operation without recharge. Therefore, the HIGH use cases require smaller batteries and solar panels than the LOW use cases.
Conclusion
RTI designed a solar power and Wi-Fi station for use in remote areas, where there are power and Wi-Fi limitations. This station uses off-the-shelf components, is easy to assemble, and is low-cost. RTI deployed the solar power and Wi-Fi stations at five locations in schools around North Carolina. Data were transmitted and collected for several weeks, but no prototype station remained online for longer than 59 days. We investigated the relationship between actual sun exposure, expected inclement weather, good battery health maintenance, and ability of the solar panel to deliver recharging. We updated the capacity of the battery and size of the solar panel to align with field tests, which resolved the challenges with the prototype design. Recommendations for battery size and solar panel size are provided so citizen scientists and others can produce solar power and Wi-Fi stations for their particular applications.