

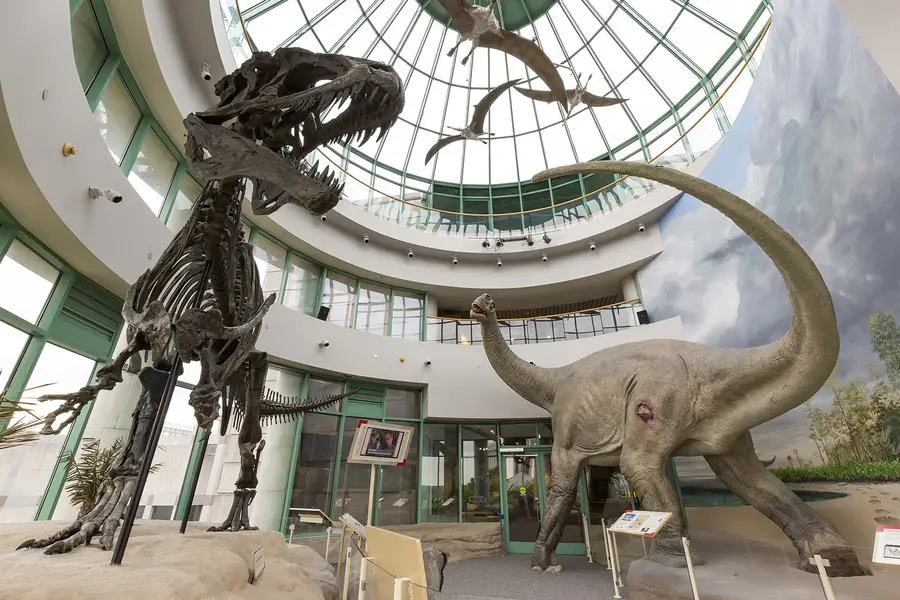
Early in 2020, a partnership between Lab 58 and the NC Museum of Natural Sciences formed to use computer vision to explore the question, "How do museum visitors choose to move throughout an exhibit?" The sequence in which visitors consume museum content is significant to the exhibit's overall design. Designers provide information to visitors in a carefully structured way to be sure the message of the exhibit is easily understandable. Still, they also want to foster a sense of openness and allow visitors to explore the museum freely.
Museums are meant to display the wonders of the world around us and foster the enthusiasm and curiosity of their visitors, and the whole experience is significantly less fun if it feels too linear. Museum designers have anecdotal understandings of how visitors consume information in each exhibit, but trying to understand museum patrons' collective behavior over time is quite a difficult task. Museum staff had to rely on manually collecting observations of visitors in the museum, which is very labor intensive, or rely on visitor surveys, which can present a host of issues and still may not be as accurate as one would like.
A research team in RTI's corporate innovation lab, Lab 58, developed an applied computer vision solution to this problem using a surveillance camera, a hard drive, computer vision algorithms, and clever coding. Let's take a look at the components of this application.
What is Computer Vision?
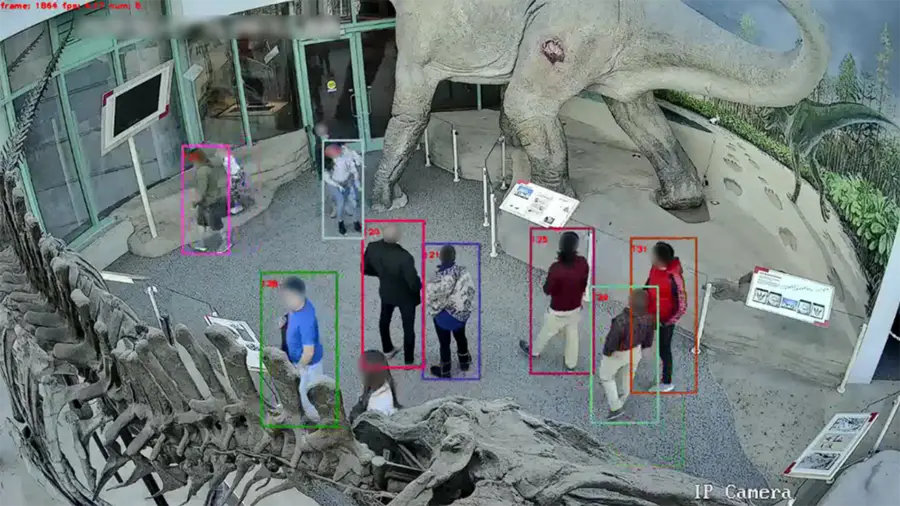
How can just one camera offer a solution to this issue? The answer to that is an artificial intelligence technology called Computer Vision. Computer Vision aims to allow computers to make sense of images and videos just like a human would. To accomplish this, algorithms are trained on very large datasets of images. With enough images, the algorithm will learn enough features of the object and be able to identify if an image contains that object. More advanced algorithms can even determine where that object is in an image, outline the object, and track how that specific object may move from frame to frame.
For our research on museum visitors, computer vision can be preferable to human vision in several ways. Computers don't get tired, distracted or bored; they don't accidentally influence how people move through the exhibit; and they can sense infrared light and other things humans cannot. Perhaps the most important distinction is that computer vision can carefully observe how multiple people move through an exhibit simultaneously. Suppose 30 children on a school field trip enter an exhibit and instantly scatter. Human eyes may have a tough time observing how the students choose to move throughout the exhibit, but computer vision will excel at that task.
Why Cameras Instead of Some Other Sensor?
This sort of tracking could be done with other technologies, sure. RFID tags visitors carry with them, Indiana Jones-style pressure plates in the floor in front of exhibits, or even the classic museum staff member with a tally counter could all get the job done. Cameras are cheap, widely available, easy to install, and commonplace enough to not be distracting in the exhibit. One camera with an ideal vantage point could potentially survey movements in an entire room. Camera installation for this experiment took less than an hour, and even installing cameras high in the exhibit only required one technician in a scissor-lift. Power had to be run to the camera and video was wirelessly fed to a receiver box in a closet off the exhibit. The whole setup was incredibly efficient and low-profile.
Our Approach to Data Collection in the Museum
Data collection for our experiment involved recording video for several weeks in early February for a few 30-minute segments each day. A sign was placed outside of the roomto inform visitors when the recording was occurring and let them know they could come back at another time if they were uncomfortable being recorded. Files were collected from the museum and luckily were prepared for analysis just before the COVID-19 shutdown went into effect.
The algorithm used to analyze the footage was developed using several open source python wrappers and pre-trained models. Most notably, the FairMOT model was used for human identification in the footage. OpenCV Python was used to image and video reading. Cython-bbox was used to create the bounding box around identified humans in the exhibit, and Matplotlib was used to generate output visualizations. A virtual machine was created within Microsoft Azure to run the analysis, and to reduce the amount of processing required for each video clip, the algorithm was written to only analyze every 3rd frame.
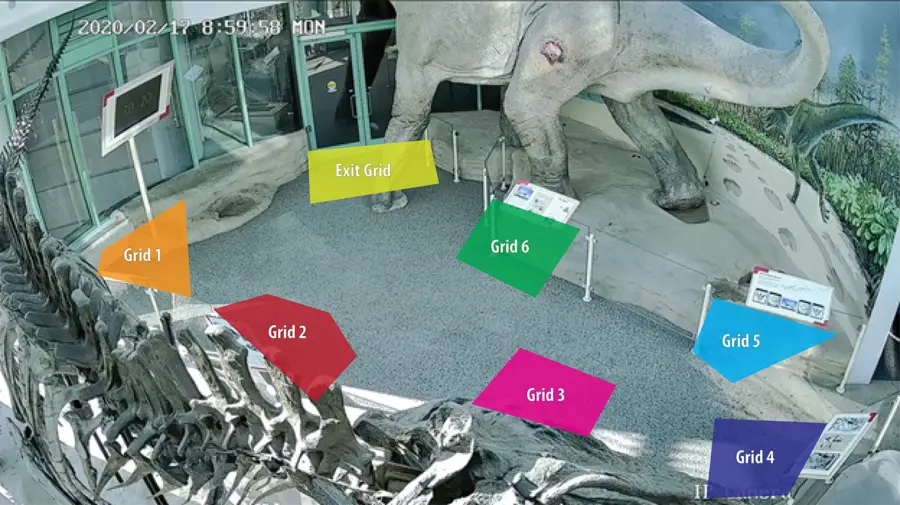
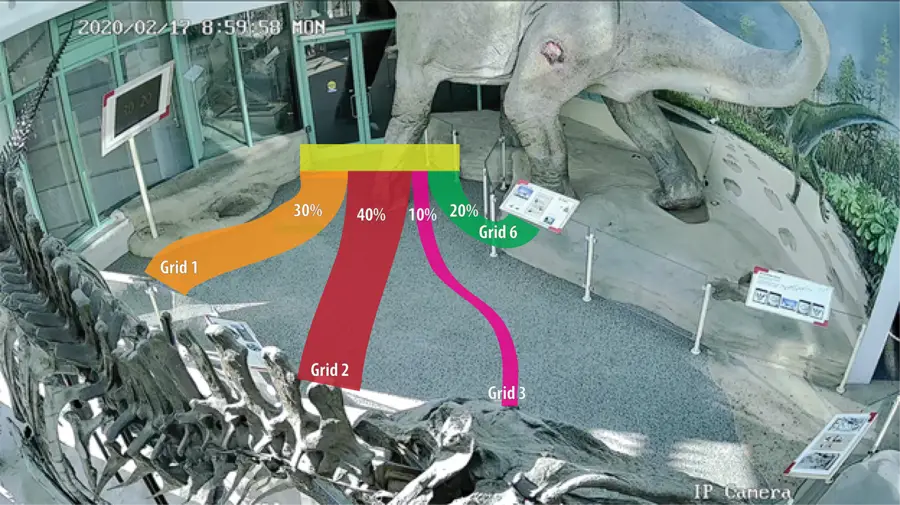
Several areas of interest, referred to as "grids," were marked and defined into the algorithm so the computer would measure when people interacted with those areas. Each grid corresponds to an information board in the exhibit that museum designers wanted to gain information about.
Insights from Computer Vision
An important caveat to note before discussing insights derived from this work is the "Re-IDing Issue." When visitors become obstructed or even partially obstructed by objects in the exhibit, the algorithm loses recognition of them. When it regains recognition, it will sometimes assign a new ID tag, making consistent movement tracking of one person difficult. The sauropod leg or the arcocanthosaurus skull in the exhibit are prominent perpetrators, but visitors can also become obstructed by other visitors or objects such as strollers. In our results, some grids are more heavily impacted by this issue than others.
The simplest way to derive insights from the algorithm's output was by counting the number of grid triggers for each grid and comparing them. For each frame, the algorithm would output one line for each person successfully identified and mark which grid they were currently in or mark them as not in any grid currently. With that output, a "Grid Popularity" measurement was built.
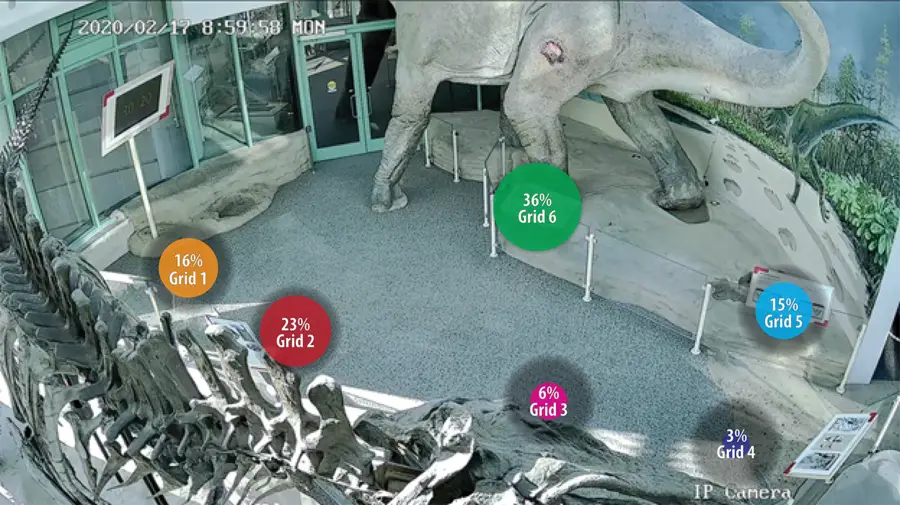
This method showed that the information boards closest to the exhibit entrance were the most popular, with exhibits becoming less popular the further into the exhibit they were. These results are heavily impacted by the re-IDing issue, which we believe lead to the under-counting of the two grids in the bottom of the camera's field of view.
Some issues with this method are that there is no distinction between one person standing in a grid for 10 minutes versus 10 people in a grid for 1 minute each. Additionally, there is no minimum threshold to be counted in a grid, so even if a person just walks through a grid but does not interact with the signage in that grid, they are still counted.
To address those issues, a timing interpolation algorithm was developed. The timing interpolation algorithm looks at each instance of a visitor entering a grid and measures how long that instance occurs. This can be useful for understanding the average amount of time spent in each grid and eliminate triggers from grids that may have just been from visitors passing through the grid without reading the signage.
A final algorithm was developed to determine how visitors choose their path of travel through the exhibit on a large scale. This process looks at each unique ID and lists which order they visited the grids. This algorithm's outputs can be visualized as alluvial diagrams to understand how visitors move through the room. See below the observations of how visitors choose to move from the exhibit entrance.
Computer Vision: Looking Forward
Computer Vision is a technology with a fantastic number of potential applications to be explored. It could be used to maximize not just learning spaces like museums, but also retail or other workspaces. It could help autonomous vehicles navigate streets safely, identify errors in manufacturing processes, help doctors examine patients, or translate signage into any language needed. During the ongoing pandemic, computer vision could even monitor if people adhere to social distancing guidelines in public spaces. The list of applications is frankly massive.
The Lab 58 team hopes to continue to build upon the knowledge gained during this experiment by developing new capabilities and implementing the technology into new areas. Research is being done into analyzing information captured with additional types of sensors like FLIR or depth-sensing cameras and into analyzing footage taken by drones.
Disclaimer: This piece was written by Jake Harrison to share perspectives on a topic of interest. Expression of opinions within are those of the author or authors.


