Introduction
The healthcare reimbursement system is shifting from one based on the volume of services provided to one based on the value of care provided. Value-based care models often set a benchmark for expected expenditures in the form of capitation or bundled payments. To be able to implement these value-based care models, expenditures often need to be compared across settings and regions. Anesthesia expenditures vary considerably, and they are a nontrivial component of a surgical episode. Anesthesia services and anesthetic plans can vary widely by surgical procedure, duration of procedure, level of intraoperative anesthetic management/monitoring, and anticipated postoperative level of care. Patient comorbidities and other factors may also influence the anesthetic plan and intra-operative anesthetic management. Analyses of anesthesia services require comparisons of expenditures, quality, and other outcomes across settings, facility types, and provider types. To ensure that like comparisons are being made, variations in anesthesia services need to be controlled for.
Although studies have used a variety of proxies, no single variable or measure captures the intensity of an anesthetic management/monitoring plan while accounting for both the complexity and duration of the surgical procedure (Dulisse & Cromwell, 2010; French et al., 2016; Sinclair et al., 2014). This lack of an anesthesia intensity metric is especially acute when using cross-sectional administrative claims data, a common analytic dataset (Healthcare Cost and Utilization Project (HCUP), 2019). Without a measure to control for intensity, comparisons of anesthesia service outcomes across settings may not be as robust.
The American Society of Anesthesiologists (ASA) Relative Value Guide (RVG) provides a mechanism for linking the anticipated complexity of the anesthetic plan to a specific surgical procedure. This is accomplished by assigning “base unit” values to Current Procedural Terminology (CPT) codes on the anesthesia claim. The rationale underlying the ASA base units is that they reflect the complexity of both preoperative evaluation and planning and implementing the anesthetic plan (Sinclair et al., 2014). Higher base units are assigned to anesthesia CPT codes with higher average anticipated difficulty in anesthetic plans and preoperative evaluation complexity. For example, anesthesia for procedures on veins of the lower leg (CPT code 01520) is assigned a base unit of 5, and anesthesia for procedures on major lower abdominal wall blood vessels (CPT code 00880) is assigned a base unit of 15. Of the 272 anesthesia CPT codes assigned base units, the most common base unit is 5, associated with 53 CPT codes; only 35 percent of all anesthesia CPT codes have base units of 7 or higher (Centers for Medicare & Medicaid Services (CMS), n.d.-a).
Base units are an important component of the expected intensity of an anesthesia service. Although some studies use base units alone to quantify anesthesia intensity, the intensity of an anesthesia service is also determined by the duration of the service, which can be measured by the associated time units (the amount of time for the anesthesia service as recorded on the medical claim) (Dulisse & Cromwell, 2010). Longer-duration anesthesia services require a longer period of vigilance with direct anesthetic management and monitoring and have a greater probability of requiring an intraoperative patient hand-off. Alternatively, some studies have used time units alone as a measure of anesthesia intensity. Silber and colleagues (2011) examined time units on Medicare claims for anesthesia services as a proxy for intensity and found that they were predictive of the actual duration of a service and that accounting for patient comorbidities and other factors did not improve the measure’s predictive power (Silber et al., 2011). Although duration of anesthesia services is indicative of the procedure’s intensity and, as stated in Schwartz’s Principles of Surgery (Brunicardi et al., 2014), longer services have been linked to increased likelihood of injury and mortality, base units also provide valuable information about the intensity of the anesthesia service provided.
In addition to base units and time units, patient comorbidities are often used as control variables in studies of anesthesia services. Sinclair and colleagues used comorbidities to account for intensity of anesthesia; however, their process is complicated and requires access to medical records and a chart review (Sinclair et al., 2014). French and colleagues also used medical records to account for intensity in their study of time-driven, activity-based costing of anesthesia services for oncologic procedures (French et al., 2016). Patient comorbidity data require medical records, which may involve complicated, time-intensive chart reviews, or longitudinal administrative claims data on a cohort of patients, which can be prohibitive or costly to access for many researchers. Cross-sectional claims data that do not follow the same patients across time are often used for analyzing anesthesia services and patient outcomes. These types of analyses would benefit from a robust measure of anesthesia intensity. This measure could be used with or without additional indicators of patient comorbidity. While patient comorbidities may explain some of the heterogeneity in anesthesia outcomes, much of the heterogeneity in anesthesia intensity may be explained by the duration of a service (Silber et al., 2007).
The implementation of value-based care models involving surgical procedures requires an accurate comparison of anesthesia expenditures, but to our knowledge, the literature lacks a uniform simple construct for researchers to use. In this paper, we describe a novel, easy-to-generate measure of anesthesia service intensity using administrative claims data that can be used to adjust commonly reported outcomes. This measure is particularly useful in the absence of other longitudinal patient comorbidity indicators. Comparing outcomes and quality across settings and provider types is a common goal of many research studies focused on anesthesia services. We provide an example of how our measure of anesthesia intensity can be used to adjust outcomes across settings for more accurate comparisons of anesthesia services.
Methods
Data
For this analysis, we used the 2014 CMS 5 percent Medicare Parts A and B limited dataset, a random sample of 1 of every 20 Medicare beneficiaries (Centers for Medicare & Medicaid Services (CMS), n.d.-b). We selected beneficiaries in traditional fee-for-service Medicare. For these beneficiaries, we identified inpatient surgical claims using Medicare Severity Diagnosis Related Groups in the inpatient file. Surgical claims in outpatient and ambulatory surgical center settings were identified using Healthcare Common Procedure Coding System codes (10021–69990) in the outpatient and carrier files.
We matched surgical claims to corresponding claims for anesthesia services. The method for identifying and matching surgical claims to anesthesia claims varied by surgical setting. We matched anesthesia claims in the carrier file to inpatient surgical claims using the unique beneficiary identifier and a service date within 3 days of the beneficiary’s inpatient procedure date. For outpatient and ambulatory surgical center surgical claims, we matched anesthesia claims using the unique beneficiary identifier and the service date. This sample included only surgical claims that matched to at least one anesthesia claim (97 percent of surgical claims had a match). The unit of observation for this analysis was the matched anesthesia/surgical claim. Our dataset contained 498,076 unique observations.
Methods
The two key variables for our anesthesia intensity measure, base units and time units, are found on the Medicare anesthesia claim line. One surgical claim could match to more than one anesthesia claim line. We included all matched anesthesia claim lines; on average, 90 percent of surgical claims matched to four or fewer anesthesia claim lines. To create a surgical claim–level measure with multiple anesthesia claim line matches, we averaged base units across all anesthesia claim lines and summed the time units. Because base units are averaged across the multiple anesthesia claim lines matched to a surgical claim, when we refer to the level of a base unit, such as a base unit of 5, we are referring to all claims with an average base unit of at least 5 but less than 6.
Base units and time units are on different scales; CPT base units are represented by integers, ranging from 1 (anesthesia for second- and third-degree burns) to 30 (anesthesia for intraperitoneal procedures in the upper abdomen including laparoscopy) (Centers for Medicare & Medicaid Services (CMS), n.d.-a). Time is also represented by integers (each time unit represents 15 minutes, so a time unit value of 4 represents 1 hour). A measure that represents both base units and time units requires rescaling of the time component to avoid overwhelming the base units, which occur on a narrower numerical range. For example, using a simple addition method without time transformation, a claim with a base unit of 4 and a time unit of 10 has an intensity score of 14, higher than that of a claim with a base unit of 8 and a time unit of 4 (intensity score of 12). In general, without transforming the time units, summing base units and time units creates a measure of intensity that is primarily driven by differential time units, rather than base units. To transform time, we divide it (explained as follows) and then add the transformed time units to the base units.
Time and base units are positively correlated (0.30 in our sample), with higher base units generally associated with longer procedures. To maintain a relatively constant effect of time on the intensity measure, we want to allow the time-transforming divisor to increase for higher base units. To keep measure construction straightforward, we divided the sample into five groups based on natural breaking points in the associated base units (shown in Table 1) and selected a different divisor for each group. The groups were chosen by examining both average time of the group and the effect of possible time divisors; the groupings mirrored those used by Sinclair and colleagues: “Using the well-established ranking of case difficulty within the ASA RVG, five categories were created according to the number of base units (≤6, 7–9, 10–13, 14–19, and ≥20)” (Sinclair et al., 2014).
Table 1.
26740Base unit groupings for creating time divisors using 10 percent weights for time
Time units are the other key component of our intensity measure. Silber et al. found a 0.94 Spearman correlation between the anesthesia procedure time reported on the medical chart and the Medicare claim with a median difference of only 5 minutes, demonstrating that Medicare claims can be a reliable data source for anesthesia procedure times (Silber et al., 2011). A meaningful decision was how much weight to give time. In this study, we define the weight of time as the percentage of claims that have intensity scores at least one level (a full integer unit) higher than their original base unit; the difference between the intensity score and the original base unit is the effect of time. We calibrated the divisors so that approximately 10 percent of claims would have an intensity score one or more levels higher than the base unit. In Table 2 in the Results section, we explore alternative weighting schemes.
For the 10 percent time weights, we set the divisors to allow approximately 10 percent of the claims in the group to move up one or more integer levels of intensity higher than the original base unit. For example, 90 percent of claims in group 1 have time units of 17 or lower. If we divide the time units by 17, then add the rescaled time units to the base units, approximately 10 percent of claims in group 1 will have an intensity score one or more levels above the original base unit. Table 1 shows the five base unit groups with the number of claims in our sample, the average time unit, and the divisor assigned for the transformation of time associated with 10 percent time weights for the intensity measure.
The following equation provides a general summary of the measure calculation. Intensity (I) for claim i is a function of the base units (B) for claim i plus the transformed time units for claim i. Transformed time units are time (T) for claim i divided by the weight assigned to time for group j.
Ii = Bi + Ti/Wj
Results
By design, the intensity measure is closely related to the base units (correlation coefficient = 0.9713) and is also correlated with time units (correlation coefficient = 0.5089) (correlations with 10 percent time weights). As noted previously, the weight of time refers to the percentage of claims that are allowed to have an anesthesia intensity score one integer level (or more) higher than the original base unit. In Table 2, we varied the group divisors to generate a variety of time weights ranging from 5 percent to 30 percent. For example, to create a 20 percent time weight, we found a divisor for each group so that 20 percent of the group had an anesthesia intensity one integer level or more higher than the original base unit. As the weight of time increases, the percentage of claims with an intensity score higher than the base unit increases.
Table 2.
26741Percentage of claims with intensity scores above original base units using various “weights”
Note: The percentage of claims with an intensity score one level above the original base unit may not exactly match the weighting designation because the weights are created using time units, which are integers; therefore, percentages can only be approximated. For example, in group 1, 89.57 percent of claims have time units of 17 or lower, and 91.83 percent of claims have time units of 18 or lower, so we set the 10 percent time weights at 17, where approximately 90 percent have time units of 17 or lower.
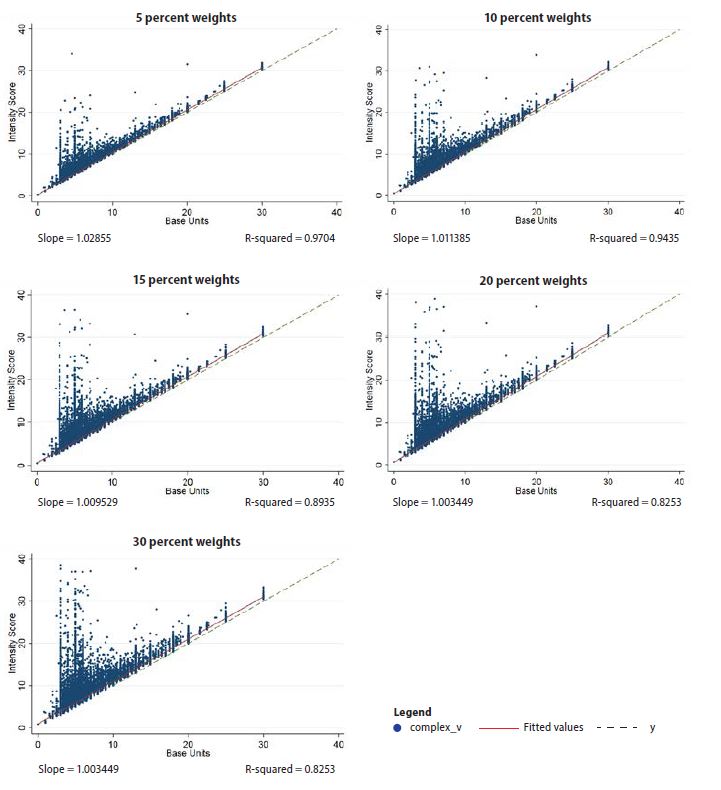
Figure 1 shows the relationship between anesthesia intensity score and the base unit as the weighted treatment of time changes; each point represents a single matched claim. The solid line is the slope of the fitted line, and the dotted line is the identity line (x = y), or what the fitted line would look like if the intensity score was always equal to the base unit. Displayed under each graph is the slope of the fitted line and the R-squared from a simple regression of the intensity score on base units. The R-squared is an estimate of the amount of variation in intensity score explained by base units; an R-squared of 1 is a perfect estimate. In general, although there is volatility in the lower base units (group 1—the largest group—with base units of 6 or lower), the intensity score and base units track fairly linearly, as is apparent in the graphs showing slopes close to 1 (in particular the 5 percent and 10 percent weight graphs). The notable difference between weights is the number of claims that are 1 or more units above the original base units. The percentage of these claims by weight is listed in Table 2, and these claims are visible in Figure 1 as the dots above dashed lines.
Figure 1.
26744Graph of intensity score and original base units using a variety of weights for time
Note: Intensity score outliers over 40 were dropped to preserve scale. At 5 percent, this is only 1 claim, which has a base unit of 4; at 10 percent and 15 percent, this is 2 claims, which have base units of 4; at 20 percent, this is 4 claims, all with base units of 5 or lower; and at 30 percent, this is 14 claims, 11 of which have base units lower than 6.
Application
A common outcome used in an analysis of anesthesia services is expenditures on anesthesia services, and often we want to compare them across settings, facility types, and provider types (Burgette & Quiñonez, 2018; Sjogren et al., 2016). Adjusting anesthesia expenditures for intensity can make for a more accurate comparison because the intensity of anesthesia services may not be uniform across settings. For example, in our sample, the average base units per anesthesia claim among surgical facilities in rural locations was lower than that for surgical facilities in urban locations.
In Medicare, anesthesia expenditures are calculated as the sum of base units and time units multiplied by the locally adjusted anesthesia conversion factor, and expenditures vary according to the anesthesia delivery model (i.e., whether the service is performed by the anesthesiologist alone, a certified registered nurse anesthesiologist alone, under medical direction, or under supervision). As described in the methods section, adding untransformed time units to base units may confer a disproportionately large time influence on the intensity measure. This disproportionate influence of time comes at the expense of base unit information.
For illustration, consider two example claims (time for procedures estimated by Silber et al.) (Silber et al., 2011): one for 135 minutes of anesthesia during a knee procedure (CPT code 01402, a base unit with a value of 7, and 9 time units) and another for 180 minutes of anesthesia during a thoracotomy procedure (CPT code 00410, a base unit with a value of 4, and 12 time units). As shown in Table 3, both anesthesia services in our example would have the same intensity level if we simply summed base units and time units (simple intensity = 16); however, our adjusted intensity measure preserves base unit data by using transformed time units, and the resulting intensity levels are 4 and 7, respectively.
Table 3.
26742An example of the effect of transforming time in measuring anesthesia intensity
Note: Silber and colleagues estimated the anesthetic time for several different types of procedures including knee (median of 135 minutes, or 9 time units, rounded) and thoracotomy (median of 180 minutes, or 12 time units, rounded) (Silber et al., 2011).
Using the same example, consider if the thoracotomy took 360 minutes (24 time units) instead of 180 minutes (12 time units) as in our first illustration. The simple intensity score would increase to 28, reflecting the duration of the procedure more than the assigned base unit value. In this second example, the anesthesia service with the lower base unit value (thoracotomy) would appear significantly more intense than the higher-base-unit-value anesthesia service for the knee procedure. Using our adjusted intensity measure with transformed time units, the intensity level of the thoracotomy would only increase from 4 to 5, tempering the effect of time units.
In our analysis for this report, we adjusted the Medicare payments associated with each surgical claim. To adjust for intensity, we first found the mean intensity score across all claims and divided the intensity score on each claim by the average score to create a ratio reflecting higher or lower intensity compared with the mean. An intensity ratio of greater than 1 means a claim is more intense than average. We divided the expenditures on the claim by the ratio, hence more intense services have lower adjusted expenditures compared with unadjusted expenditures.
In Table 4, we compare unadjusted and adjusted expenditures by setting (rural versus urban). We calculated the percentage change from the adjustment for each setting. Because urban settings tended to have higher average anesthesia intensity per claim (at the 95th percentile, the urban intensity score is 10.49 and the rural score is 8.36), the adjustments in urban settings are greater (a 10 percent decrease at the 95th percentile in urban settings compared with a 1 percent increase in rural settings).
At the 95th percentile, unadjusted expenditures in urban settings are roughly 36 percent higher than in rural settings ($840 vs. $619); adjusted expenditures in urban settings are only 23 percent higher than in rural settings ($765 vs. $623). There is a similar decrease at the mean: unadjusted expenditures in urban settings are roughly 26 percent higher than in rural settings ($372 vs. $276), whereas adjusted expenditures in urban settings are only 20 percent higher than in rural settings ($373 vs. $297).
While this difference may seem relatively small, hospitals often operate on margins as low as 1–3 percent, so even seemingly small changes in revenues can have a significant impact on margins (Daley, 2018; Masterson, 2018). When expenditures are compared with benchmarks in a value-based care model, these adjustments could impact a model participant’s bonus or penalties.
Table 4.
26743Adjusted Expenditures, Rural and Urban
N/A = not applicable.
Limitations
This is formative work, so limitations must be addressed. In creating this measure, we used the Medicare 5 percent limited dataset. A different sample may have a different distribution of base units and time units, which could affect the choice of divisors for transforming time units in the iterative process. A next step for this measure would be a sensitivity test on different samples and different populations (i.e., a non-Medicare dataset). Despite differences in samples, the general iterative method established here can be followed to create a simple, transparent measure of anesthesia intensity from cross-sectional medical claims data. However, the measure may need to be calibrated to match a different sample’s distribution of base units and time units.
We acknowledge that our decision to use the 10 percent weights influenced our results. We compared different weighting schemes for the intensity measure and acknowledge that different weights may be more appropriate in different samples or different settings; this decision would be left to the researcher based on individual study needs. For example, in a study using data with robust comorbidity indices, researchers may want to upweight time units relative to base units, as base units primarily reflect patient health status, which would be somewhat redundant when also using robust comorbidity indices. When using cross-sectional data, or data without reliable indicators of patient health status, researchers may want to more evenly weight time units and base units because the base units will play a larger role in providing information on comorbidities.
We did not have access to health records or longitudinal data, which prohibits us from adjusting for patient comorbidities. We are not suggesting that patient comorbidities are irrelevant to the complexity or duration of anesthesia procedures; rather, we posit that, because patient health status and comorbidities are reflected through the base units assigned by the anesthesia team during the preoperative evaluation, a measure of anesthesia intensity can be constructed from cross-sectional claims data in the absence of these elements.
Discussion
Common perioperative research questions, and value-based care models involving surgical episodes, require comparison of anesthesia services on expenditures, quality, and other outcomes across settings, facility types, and provider types. However, a direct comparison of outcomes may not be completely accurate without adjusting for the intensity of anesthesia services. To our knowledge, a simple, standardized formula for creating a composite measure of anesthesia intensity from cross-sectional administrative claims data does not exist.
Anesthesia intensity can be expressed as a function of complexity and duration, and two readily interpretable variables in claims data contain relevant information—the base units associated with the CPT code and the time units. To create a measure of anesthesia intensity that represents the contribution of procedure duration while preserving the measure of procedural complexity, time units must be transformed. Base units and time units on medical claims are reported on different scales, and, without transforming time units, they would dominate a simple claims-based measure of intensity.
In this manuscript, we describe a straightforward method for creating a measure of anesthesia intensity that captures base units and duration of procedure with appropriate rescaling of time. Our measure of anesthesia intensity can be created using cross-sectional data alone, which are often the data researchers have available. In the absence of longitudinal data or the ability to control for patient comorbidities, researchers retain the option to adjust anesthesia outcomes for intensity using our intensity measure.