Key Research Needs
Data-driven projections of the potential long- and short-term crop yield changes resulting from increased adoption of irrigation practices among farmers in SSA.
Collection of high-resolution hydrologic field data for validation of groundwater resource estimates across sub-Saharan Africa.
A detailed assessment of current groundwater abstraction governance in Ethiopia and other nations in SSA for clarity on abstraction limits and transboundary aquifer agreements.
Introduction
Sub-Saharan Africa (SSA) is home to roughly 1 billion people, but less than half of them have access to electricity (World Bank, 2019) primarily because of inadequate last-mile infrastructure, which is needed to connect households to public power lines (World Bank, 2021a). Most SSA countries are represented by a rural population (World Bank, 2020) that may consist of smallholder farmers and community farms loosely distributed across the available arable land (World Bank, 2019). The remainder of the population is urban; most urban populations are concentrated around major cities where the national power grid is likely to be more accessible. Grid expansion in SSA is often limited by how difficult it is for companies to reach customers physically and financially, as seen by programs like the Access to Distributed Electricity and Lighting in Ethiopia (ADELE) program, which is funded by the World Bank and jointly implemented by the Development Bank of Ethiopia, Ministry of Water and Energy, and Ethiopian Electric Utility. The ADELE project information document states that Ethiopian off-grid solar (OGS) companies often lack the resources needed to electrify populations in remote locations where distribution channels are not yet developed (World Bank, 2021a). Furthermore, the ADELE project information document states that Ethiopia’s market lacks sufficient financing options for consumers considering connection (World Bank, 2021a). Thus, programs like ADELE prioritize off-grid development as a critical component of national electrification efforts, with Ethiopia expecting to have about 35 percent of its population supported by off-grid solutions once universal access is achieved (World Bank, 2021a).
With national grid expansion lagging in most SSA countries, OGS electrification has become a proven and sensible option for rural electrification projects because of the continued decrease in the cost of solar photovoltaic (PV) equipment alongside the added benefit of expanding carbon-free power generation. Solar home systems have recently been a solution of choice for electrification initiatives in SSA because these systems are relatively affordable and typically allow for a variety of tiered pricing options based on electrical needs and financial capacity. Although solar home systems have been widely adopted in several SSA nations for improvements in small-scale lighting and charging, they have been shown to offer only minor improvements in terms of overall quality of life, employment, and income. For example, Stojanovski, Thurber, and Wolak (2017) found that no households in a group of 500 early adopters were using their solar home system products to support income-generating activities.
OGS solutions can help establish accessible electrical infrastructure in places where public services and infrastructure may be heavily limited. This has the potential to directly improve the livelihood of the people living in these areas by enabling income generation and potentially increasing commercial activity (World Bank, 2021a). Solar mini-grids are larger systems that can serve the energy demand of multiple users, but they require larger capital investment before implementation than solar home systems. In addition, mini-grids often require collaboration between local governments, financial institutions, and energy/power developers, at a minimum, to ensure implementation. A lack of local or regional collaboration can become an unforeseen obstacle to mini-grid implementation, so OGS solutions that imply clear benefits to all stakeholders involved are favorable and more likely to reach final stages of development.
A key obstacle that discourages widespread adoption of medium- to large-size OGS systems in SSA is a lack of viable financing options available to potential customers and investors (World Bank, 2021a). In Ethiopia specifically, there have also been regulatory limitations regarding business, licensing, and investment that inhibited certain mini-grid business models. In 2020, however, the World Bank helped the Ethiopian Energy Authority establish a “mini-grid directive,” which is designed to address these issues and provide regulatory clarity regarding tariffs, licensing, and technical standards (World Bank, 2021a). National-level directives like this are essential in encouraging the private sector involvement necessary to establish a sustainable off-grid development market. As regulatory environments become clearer for off-grid developers and investors in SSA, it is reasonable to expect that their desire to understand how and where potential solutions can be applied will increase.
OGS irrigation using groundwater is one example of a productive rural mini-grid solution that can establish centralized electricity access hubs in otherwise remote locations while generating income for local end-users (World Bank, 2021a). In areas where access to fresh water is more limited, there is also the potential for increased access to food and water resources via the pumped groundwater that may have previously been inaccessible.
A Case for OGS Irrigation in SSA
In this section, we present key findings from a review of relevant literature to outline the current agricultural practices of SSA and the potential growth that could result from a shift toward OGS irrigation as a commonly implemented solution. As part of this discussion, we demonstrate how private sector companies can identify target markets for their products and services using publicly available data.
Current Agricultural Practice
Rural populations living in SSA often rely heavily on agricultural activities to support both food and income generation because of a lack of alternatives (World Bank, 2021a). Most of the agricultural activity in SSA is rainfed (Dwivedi et al., 2021), but rainfall in the region has generally high spatiotemporal variability, especially across seasons (Berhanu et al., 2014). This means a large share of the region’s rural population stands vulnerable to climatic changes such as altered patterns of rainfall, drought, and flood (Berhanu et al., 2014). Although water management through irrigation has the potential to increase a farmer’s resilience to the negative impacts of climate change, irrigation is not a practical solution for many smallholder farmers because they do not have access to the water or power infrastructure required to sustain such an operation. In SSA nations such as Ethiopia, the availability of surface water resources is largely driven by seasonal rainfall patterns and the more consistent surface water sources, like rivers, are often situated in rugged terrains that are difficult to develop around (Berhanu et al., 2014).
It is estimated that only 1 to 3 percent of arable land in SSA is currently irrigated (World Bank, 2018b), which means there is widespread potential for regional adoption of irrigation as a more sustainable agricultural practice, especially in areas where there are regularly recharged and untapped groundwater stocks.
According to Hartung and Pluschke (2018), solar-powered irrigation could enable farmers to become more adaptable to climate change while benefitting from zero-carbon energy generation. Other potentially significant benefits of solar irrigation include extending the growing season, increasing agricultural productivity, and becoming independent from volatile fuel prices in cases where diesel pumps are used for agricultural practices (Hartung & Pluschke, 2018).
OGS Groundwater Pumping Potential in SSA
To promote sustainable groundwater abstraction practices, we must carefully consider freshwater recharge rates in study areas. Understanding risks associated with existing stocks can minimize the chances of groundwater projects contributing to regional water scarcity. Döll and Fiedler (2008) used the WaterGAP Global Hydrology Model to estimate global groundwater recharge with respect to total freshwater recharge based on the climate between 1961 and 1990, and they found that Africa receives roughly 2,000 cubic kilometers of renewable groundwater each year, amounting to 5 percent of total global freshwater recharge. It is estimated that Africa’s renewable groundwater sources account for 51 percent of the continent’s total renewable freshwater each year (Döll & Fiedler, 2008).
The analysis conducted by MacDonald, Bonsor, Dochartaigh, and Taylor (2012) estimates that Africa’s total groundwater storage ranges between 0.36 and 1.75 million cubic kilometers, which they claim is “100 times estimates of annual renewable freshwater resources on Africa” (p. 1). The quantitative maps that support this claim were produced by the British Geological Survey as the first of their kind, and there are currently no other publicized, quantitative accounts of groundwater resources in Africa at such a resolution. These maps present estimates of groundwater depth, productivity, and storage at a maximum resolution of about 25 square kilometers but these estimates are primarily intended to suggest areas where realistic groundwater assessments should be performed because actual borehole yields will likely vary across local regions. MacDonald et al. (2012) found that groundwater sources are often less volatile than surface water in times of meteorological change and that groundwater resources are naturally protected against pathogens and often do not require treatment. Therefore, groundwater resources have become a focal point when considering sustainable irrigation solutions, especially in areas equipped with large groundwater stocks and variable rainfall.
Ethiopia’s Irrigation: A Potential Market
Although OGS groundwater irrigation has potential across SSA, each nation has its own unique set of resources and obstacles, which means that analysis of the potential benefits from such a solution is best conducted at the national, regional, or district scale. For example, Ethiopia is estimated to receive about 39 mm of renewable groundwater each year—about 29 percent of the nation’s total freshwater recharge (Döll & Fiedler, 2008). We have selected Ethiopia as a study area because of this estimation and because it is the second most populated nation in SSA, with its agricultural sector representing roughly 38 percent of GDP in 2021 (World Bank, 2021b). In Ethiopia, agricultural activities support a large portion of the population, so practical improvements within the sector can lead to increased livelihood through benefits such as extended growing seasons and expanded arable land.
Existing agriculture, groundwater resources, and electrical infrastructure are some of the spatially explicit variables that influence the potential feasibility of OGS groundwater pumping for irrigation in an area. The overlap and proper constraint of these variables can enable developers to approximate areas with potential for OGS irrigation implementation at a regional scale, but higher-resolution data are required to inform decisions and planning at the project level. High-resolution, ground-truthed data of this variety can be used to produce more accurate projections of potential benefits arising from extended harvesting seasons and expanded irrigation. There is also a need for spatially explicit data covering the health, production, and yields of crops to fortify projections of potential crop yield increases under various irrigation schemes that leverage OGS groundwater pumping.
Methods and Analysis
In this section, we outline our exploratory analysis, which leverages publicly available data to identify areas in Ethiopia where the regional groundwater conditions present a potentially favorable environment for residential- and community-level groundwater abstraction projects. The resulting “potential groundwater hotspots” layer approximates ideal regions where investments into borehole data collection and market exploration make the most sense.
We then present four model scenarios, including three focus crops in the context of two different sizes of smallholder farms in Ethiopia, considering both high and low costs based on publicly available data. Under these scenarios, the projected investment costs, operating costs, and crop-based revenues are used to approximate the net present value (NPV) of investment in an OGS groundwater irrigation system after 20 years using a discount rate of 3 percent. The goal of this projection is to demonstrate the potential increases in crop-based revenue resulting from OGS groundwater irrigation implementation, with consideration for the return on investment (ROI). We assume conservative crop yield increases of 50 (low cost) and 75 (high cost) percent, attributed to the transition from nonirrigated water management to irrigated systems. Of note, we find a 50 percent yield increase from irrigation to be a conservative estimate. Some sources, like the International Food Policy Research Institute, present data that support average yield increases of 108 percent or more at a regional level (International Food Policy Research Institute, 2020).
Data Used in the Analysis
Table 1 describes the data that we used to approximate the potential for OGS irrigation in Ethiopia, while Table 4 through Table 6 summarize the values used in estimating ROI of hypothetical OGS groundwater irrigation systems. We divided the analysis into two parallel analyses: (1) developing a simple multi-criteria analysis for establishing initial estimates of the areal potential for OGS groundwater irrigation and (2) developing a rough model of cost and revenue associated with investment in OGS groundwater irrigation systems under different scenarios. When applied to the same region, these two combined analyses create the framework used in this paper for identifying areas where OGS groundwater irrigation shows promise as a revenue-generating intervention. We believe this type of analysis can help researchers and the off-grid private sector identify and direct resources toward potential off-grid markets.
Table 1.
121859Key variables used in the spatial analysis
Geospatial Analysis
The spatial analysis consists primarily of layer overlay using geospatial tools to clip and buffer the key variables to highlight areas in Ethiopia that are most suitable for conducting ground-truthing field research on local-scale groundwater stocks.
Potential Groundwater Hotspots
We estimated the quantity of groundwater resources in Ethiopia using the quantitative groundwater maps and underlying data produced by MacDonald et al. (2012). Higher groundwater productivity and storage values imply higher availability of groundwater resources whereas higher depth-to-groundwater values are associated with the need for deeper boreholes, resulting in more expensive drilling costs. We identified what we consider potential groundwater hotspots by constraining and overlapping the three groundwater layers shown in Figure 1: (A) depth to groundwater (0 to 50 m below ground level), (B) groundwater storage (10 to 50 m in depth of water), and (C) groundwater productivity (1 to 20 liters per second). We used the physical limits for hand-driven pumps as determined by MacDonald et al. (2012) to establish conservative minimums for groundwater depth and storage. In determining the constraints for groundwater productivity, we considered MacDonald et al. (2012) but set the minimum productivity rate higher than what is required for hand pumps (0.1 liters per second) because OGS irrigation pumping schemes require more rapid flow rates.
Figure 1.
121860Availability of groundwater resources in Ethiopia
Sources: Maps generated by RTI based on mapping provided by British Geological Survey © 2012. All rights reserved; Esri, DigitalGlobe, GeoEye, i-cubed, USDA FSA, USGS, AEX, Getmapping, Aerogrid, IGN, IGP, swisstopo, and the GIS User Community.
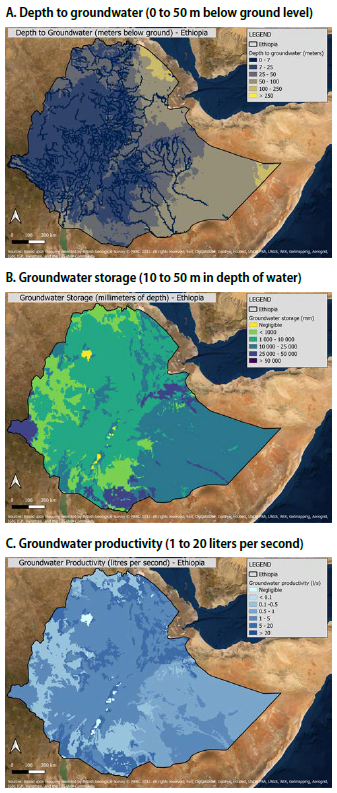
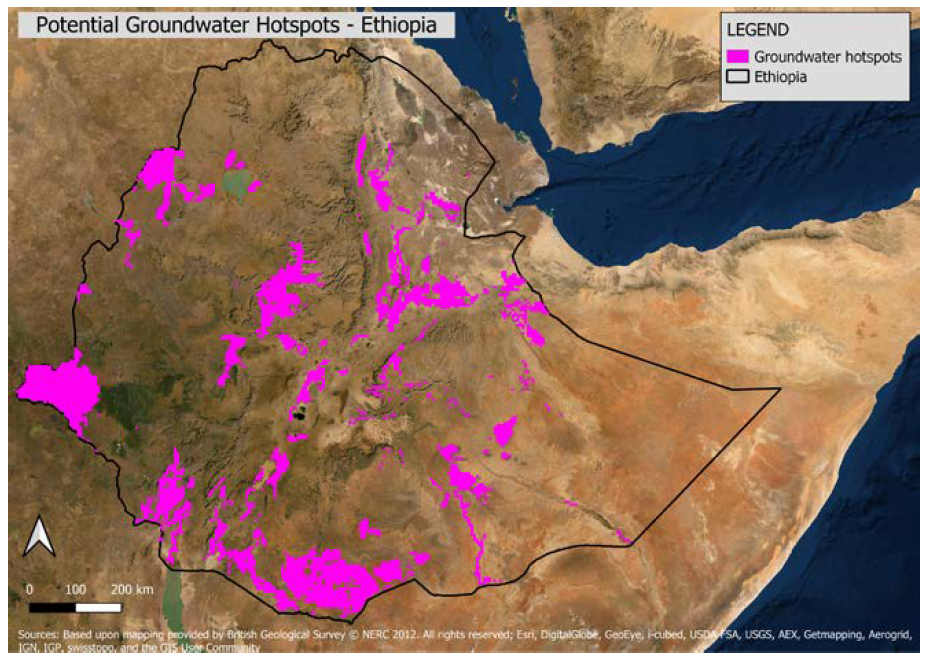
Potential groundwater “hotspots” are shown in Figure 2, which is a map representing areas where favorable values of groundwater storage, productivity, and depth are aligned but without consideration for other parameters. Unfavorable conditions such as negligible groundwater storage and productivity mostly align with large water bodies like Lake Tana, so we do not consider areas closely bordering surface-level freshwater resources in the hotspots layer unless they present unique conditions.
Figure 2.
121861Groundwater hotspots—areas where favorable groundwater conditions overlap
Sources: Map generated by RTI based on mapping provided by British Geological Survey © 2012. All rights reserved; Esri, DigitalGlobe, GeoEye, i-cubed, USDA FSA, USGS, AEX, Getmapping, Aerogrid, IGN, IGP, swisstopo, and the GIS User Community.
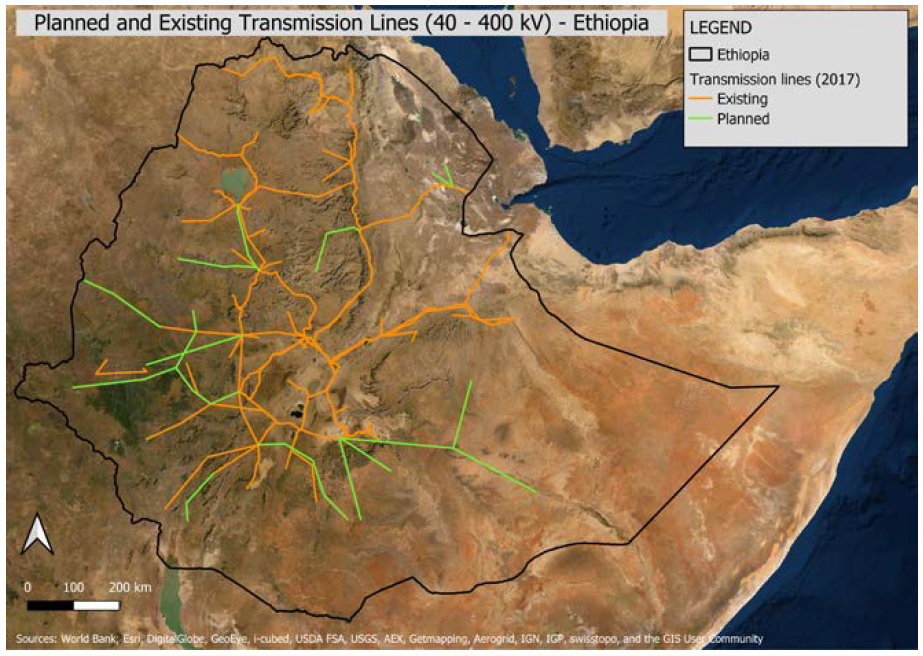
Proximity to the National Grid
Figure 3 represents Ethiopia’s existing and planned medium- and high-voltage transmission lines (as of 2017). We establish a 2.5-km transmission line buffer around the national grid based on the criteria for rural populations in Ethiopia, which includes households greater than 2.5 kilometers from the national grid (World Bank, 2021a). We then used the 2.5-km national grid buffer to constrain the groundwater hotspots layer such that peri-urban and urban areas are excluded.
Current Agricultural Water Management Landscape
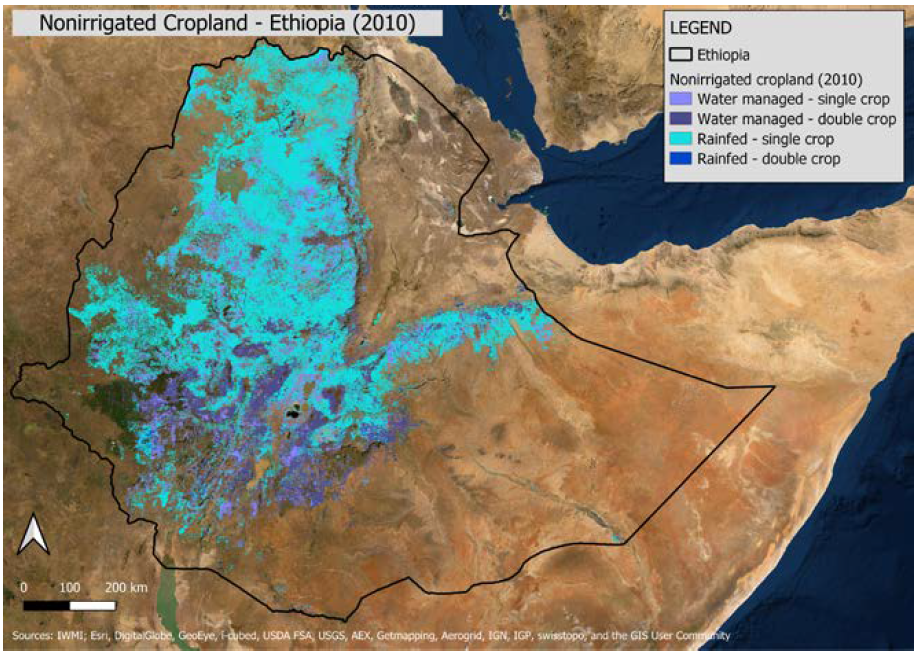
Figure 4 shows nonirrigated cropland in Ethiopia during from 2010 to 2011, by water dependence category. The water managed (lavender/purple) category does not have a formal definition provided with the original IWMI dataset, but areas under this category are not considered to be irrigated or rainfed. We adopt IWMI’s “nonirrigated” classification, which includes the water managed and rainfed categories, to constrain the groundwater hotspots layer to areas where crop harvests rely upon water management methods that are more responsive to regional weather patterns and long-term climatic change (Berhanu et al., 2014).
Figure 4.
121863Nonirrigated cropland in Ethiopia, by water reliance category
Sources: Map generated by RTI based on data from IMWI; Esri, DigitalGlobe, GeoEye, i-cubed, USDA FSA, USGS, AEX, Getmapping, Aerogrid, IGN, IGP, swisstopo, and the GIS User Community.
The pink areas in Figure 5 again represent groundwater hotspot areas but now with a focus on off-grid nonirrigated cropland. This basic overlay analysis approximates the area of off-grid nonirrigated groundwater hotspots to be roughly 1.9 million hectares, which represents nearly 12 percent of the estimated 16 million hectares of arable land in Ethiopia (World Bank, 2018a). The final hotspot areas are characterized by an overlap of rural grid connection status (mostly off-grid), potentially rich groundwater resources, and a presence of nonirrigated agriculture. These are areas are where we hypothesize that OGS irrigation activities should be viable. We propose that on-the-ground researchers and off-grid developers prioritize these areas for testing implementation feasibility to build a more real-world understanding of the potential for OGS groundwater irrigation. This type of information could also be valuable to private sector companies considering targeted marketing activities in areas where conditions are more favorable for productive uses of solar-powered groundwater abstraction. Given that the input data are limited by spatial resolution, this approximation is only intended to provide a preliminary estimate of the magnitude of land with potential for OGS groundwater irrigation.
Figure 5.
121864Overlap of potential groundwater hotpots and off-grid, nonirrigated cropland
Sources: Map generated by RTI based on data from IMWI; Esri, DigitalGlobe, GeoEye, i-cubed, USDA FSA, USGS, AEX, Getmapping, Aerogrid, IGN, IGP, swisstopo, and the GIS User Community.
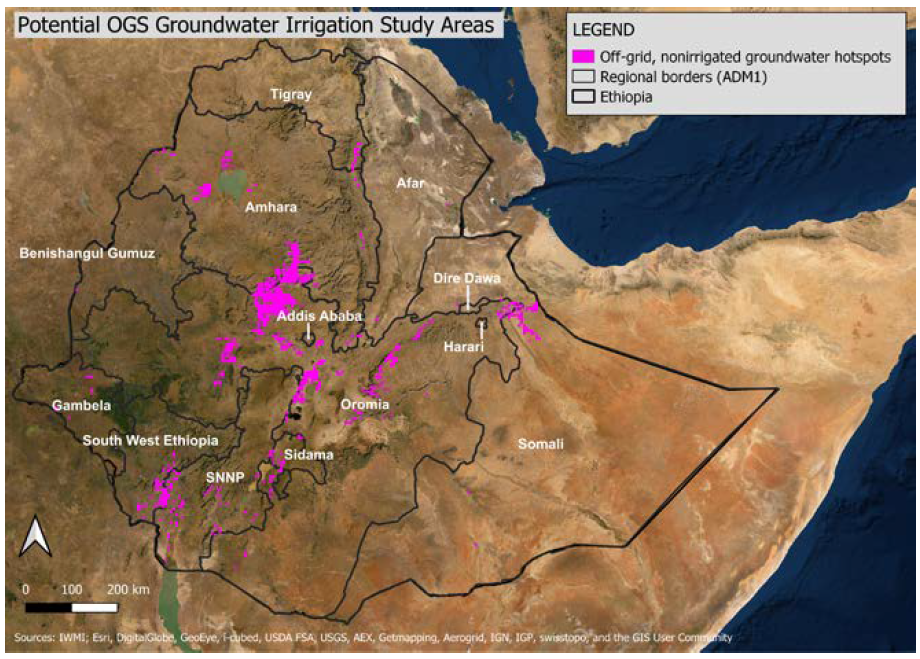
A comparison of Figure 2 and Figure 5 shows that large portions of the country, such as the Afar, Gambela, and Southern Nations, Nationalities, and Peoples regions, have significant coverage of groundwater hotspots, but they have lower coverage of cropland area. These areas represent potentially underused locations, which may benefit from the expansion of agricultural activity if groundwater abstraction-based irrigation is viable. Although the aforementioned areas represent an overlap of potentially rich groundwater resources and undeveloped land, they should be further analyzed for their ability to support agricultural activities before being prioritized as potential study sites for OGS groundwater irrigation. It is possible that physical limitations such as soil health, weather patterns, and rough terrain are why the land has remained undeveloped (nonarable land).
Current Agricultural Production and Yields
A large portion of the land area harvested during the growing season in Ethiopia is used to produce cereals, pulses, and oilseeds because they are major sources of food and income for Ethiopian households (Central Statistics Agency of Ethiopia, 2020). Cereals dominate as the staple food crops in all regions, with teff, maize, sorghum, and wheat all grown in large quantities (greater than 1 million hectares) to support food and income generation during the Meher season—defined in Ethiopia as the main growing season between September and February—each year (Central Statistics Agency of Ethiopia, 2020). Pulses and oilseeds are also produced across the country, and smallholders use these crops for household consumption and income generation. Ethiopia’s smallholder farmers also produce a large amount of root, fruit, and stimulant crops. Ethiopia’s top export in 2020 was coffee ($860m), with oilseeds ($384m), vegetables ($261m), and pulses ($186m) all being significant agricultural exports (Simoes & Hidalgo, 2011).1 See Table 2 for a summary of the top 12 crops, by harvest area, which are known providers of food and income generation in Ethiopia. We do not include vegetables because they are primarily grown in urban areas (Central Statistics Agency of Ethiopia, 2020), which are outside the focus of this paper.
Table 2.
121865Top 12 crops by area harvested in Ethiopia during the 2020 Meher season
Source: Central Statistics Agency of Ethiopia (2020).
We have chosen to narrow our focus to the top four crops grown in Ethiopia by total harvest area and the top export crop (coffee) to compare groundwater hotspot areas with regional crop production of major crops. Table 3 shows the regional summary of harvest area and yield for the selected crops. Some data points were not available; maize and sorghum are the only crops with significant production in all regions of Ethiopia.
Table 3.
121866Selected crops 2020 total harvest area and yield during the 2020 Meher season, by region in Ethiopia (Central Statistics Agency of Ethiopia, 2020)
* Regions established since 2020 (not included): Sidama; South West Ethiopia
- = no data or negligible (not recorded) value.
The Potential Value of OGS Groundwater Irrigation
We rely on estimates of average per tonne crop prices and per hectare yields across all regions in Ethiopia to establish a rough projection of the potential value-added from implementation of OGS groundwater irrigation systems, in the case of Ethiopian smallholder farmers harvesting maize, sorghum, and coffee. We have chosen to focus on maize and sorghum because these crops are grown in virtually all regions of Ethiopia, and they continue to contribute significantly to Ethiopia’s annual food production, while also serving as a source of income generation (Central Statistics Agency of Ethiopia, 2020). We also include coffee in this part of the analysis because it is Ethiopia’s number one export, and it is also grown in most regions (see Table 3). Table 4 shows the estimated total harvest areas and estimated 2020 market prices of the crops used in the scenarios outlined below.
Table 4.
121867Total area harvested, average yield, and average price of selected crops
| Crop | Total area harvested (hectares) | Yield (tonnes per hectare)a | Price per tonne (2020 $USD) |
|---|---|---|---|
| Maize | 2,274,306 | 3.25 | $481.20b |
| Sorghum | 1,828,182 | 2.49 | $563.40b |
| Coffee | 758,523 | 0.40 | $1,148.00c |
a Calculated aggregate of all available regional yields from Table 3.
b Calculated aggregate of average regional surplus and deficit crop prices from Olana et al. (2018), considering inflation from 2017 to 2020. Assumptions: food inflation increases from the 2020 CPI (Central Statistics Agency of Ethiopia, 2020).
c Uses the producer price of 40 Birr/kg from Degaga (2020). Assumptions: 1 Qt. = 100 kg; 1 Birr = 0.0287 USD from https://www.exchangerates.org.uk/ETB-USD-spot-exchange-rates-history-2020.html.
We develop four scenarios of hypothetical smallholder investment in OGS groundwater irrigation systems under various cost conditions and summarize these scenarios in Table 5 and Table 6. The four scenarios start with two basic models representing smallholder investment in OGS groundwater irrigation at two different farm sizes during the Meher season. The low- and high-cost scenarios assume a 50 and 75 percent yield increase from irrigation, respectively. This yield increase is attributed to the expected improvements to a plot’s maximum productivity resulting from the implemented irrigation system. There is a base case for both farm sizes, representing cases with no investments.
The first model system (Table 5) represents an individual smallholder irrigating 1 hectare of cropland with a shallow (15 m) manually drilled well equipped with a 170 W solar water pumping system serving drip irrigation.
Table 5.
121868System costs for a single smallholder irrigating 1 hectare
The second model system (Table 6) represents a collective group of smallholders irrigating 3 hectares of cropland with three medium-depth (30 m) mechanically drilled wells, each equipped with a 170 W solar water pump to serve the drip irrigation system covering the collective cropland. Both solar PV systems are oversized significantly to provide potential for future benefits, which are not being quantified in this analysis. (This analysis uses solar water pumps rated at 170 W. The two scenarios propose 1 and 4 kW of capacity respectively.) These benefits can include powering equipment, appliances, or lighting that might be otherwise underserved in off-grid communities.
Table 6.
121869System costs for three smallholders irrigating a combined three hectares
Under each of the four hypothetical scenarios, we first sum the total upfront costs associated with OGS groundwater irrigation installation to create the projected investment cost. Then, we calculate the projected annual revenue from harvests after applying the expected increase in yields based on the specific model and crop being analyzed. The estimated annual operation and maintenance costs are subtracted from the projected annual revenue to approximate annual profits under each investment scheme. Table 7 shows the initial investment cost and annual profit under the four scenarios across each focus crop (all investment schemes), along with a base case for each model system, which represents no changes to yields, no investment cost, and slightly higher annual labor costs. A rough payback period is included to provide further insight into the potential ROI for each scheme.
Table 7.
121870Summary of projected costs, annual profit, payback time, and NPV for each scenario
Notes: NPV = net present value; - = no data.
Almost all the projected investment schemes (including the base cases) are annually profitable, excluding both base cases for coffee production. The lack of profitability among coffee-producing scenarios stems from the relatively low coffee yields across the country. On a per hectare basis, coffee is yielded at less than one-fifth the average rate of either maize or sorghum, while coffee is only just over twice as valuable as the other two crops. This means that a larger dedicated harvest area must be considered for growing coffee as a profitable crop.
Investment schemes harvesting maize or sorghum have system payback times between 2.5 to 6.5 years. The quickest expected payback period is estimated to be about 2.5 years for the low-cost system irrigating a single hectare of maize, whereas the high-cost system irrigating a single hectare of coffee has the longest expected payback period at nearly 50 years.
Table 7 also summarizes the projected 20-year NPV of each investment scheme to provide a side-by-side comparison of all schemes with consideration for annual costs and discount. In terms of coffee production, the NPV projections after 20 years are all negative, which aligns with the expected payback periods. According to the projected 20-year NPV, the best investment scheme for total gain would be the low-cost system irrigating 3 hectares of maize exhibiting potential returns of $65,859—a return which is 61 percent larger than the corresponding base case after 20 years.
The above scenarios present two different farm sizes at which the assumed crop yields increase because of the adoption of irrigation practice. Investment in systems like those modeled here can enable smallholder farmers and communities to generate more long-term income while contributing to local food, water, and energy stocks. Given that the power systems are purposely oversized in these scenarios, we suggest that smallholders adopting similar investment schemes should be able to leverage the potential excess electricity generation for pumping drinking water and other productive power uses, such as powering equipment, appliances, and lighting.
Limitations of Analysis and Next Steps
An exploratory geospatial analysis, such as the one described previously can serve as a guide to help developers decide where to direct resources for preliminary exploration into the feasibility of OGS groundwater irrigation implementation. Moving forward, OGS developers using this type of analysis should prioritize the collection of real-world measurements of the spatial parameters considered, such as groundwater, crop yields, and crop production to identify sites for piloting projects. These on-the-ground measurements will also enable spatial analysis at higher resolution, which can more accurately identify spatial trends of the focus parameters within a focus region. Collecting and organizing higher-resolution input data will require collaboration between managers of multiple sectors (food, water, energy) seeking to accurately identify and monitor the flow of their country’s natural resources.
In addition to the input data used in the above analysis, parameters like population density, income demographics, and multiple biophysical characteristics such as soil health can be layered over targeted irrigation areas to assess market feasibility. Including these parameters can help ensure that the spatial analysis models physical reality as closely as possible.
The availability of community- and district-level crop markets data and local equipment prices can improve the accuracy of the rough ROI projection scenarios outlined here by providing local context for each scenario. Refining the projections with these data would likely show that the ROI of an OGS groundwater irrigation system can be relatively high but that it can also vary heavily depending on the regional terrain and climate where the system is located.
Moving forward, OGS research in developing nations should prioritize development pathways that emphasize quantifying and addressing consumer demand for economic resources like food, energy, and water in ways that promote sustainability and self-sufficiency. Research on market-based solutions, like OGS groundwater irrigation, will encourage the establishment of collaborative information networks that can properly store, collect, and plot information that both the public and private sectors can use for implementation planning. Collaborative data collection networks can support the completeness of our overall understanding of Africa’s (and the world’s) available natural resources and their limits with respect to harvesting. Networks like these can also inform resource governance to better protect and sustain the quality and quantity of natural resources.
Sustainable groundwater governance and policies are essential when considering OGS groundwater as a solution because groundwater networks can be particularly sensitive to distributed abstraction, especially if it is excessive. The bulk of Africa’s groundwater stocks exists in deep storage that has accumulated over a longer period, as opposed to being replenished more frequently in shallow quantities. Thus, any excessive abstraction of groundwater could be detrimental. Excessive abstraction can quickly deplete fresh groundwater resources, increase saltwater intrusion, and decrease surface water flow; compounding these negative effects with lower groundwater recharge rates can lead to long-term regional scarcity.
Conclusion
International development initiatives are continuing to promote economic growth in developing nations by providing the initial institutional support and finances required to jumpstart economic activity at all consumer levels. However, initial successes are running into the real-world barrier of limited consumer-based disposable income available to support expansion of OGS solutions into the communities that need them most. Off-grid electrification initiatives like ADELE should prioritize investments that promote revenue-generating activities to capture the desired long-term improvements in standards of living. Tying solar initiatives to revenue-generating efforts can help create successful and sustainable markets in remote locations of developing nations by empowering consumers with stable access to resources that were previously scarce or nonexistent. Developing nations will continue to place greater demand on their critical systems (food, energy, water) as their populations expand. Solutions that will help these countries establish resiliency within their resource sectors are becoming increasingly necessary in supporting sustainable economic growth. OGS is a technically proven solution for rural electrification as the growth of the global solar industry continually drives equipment costs down. Policymakers in participating economies must collaborate with private power producers and equipment distributors to create incentives for public–private cooperation such that a sustainable and lucrative supply chain is established for OGS equipment. Private enterprises must work with public institutions to conduct research and fill vital information gaps regarding consumer characteristics and technological feasibility.