The science, technology, engineering, and mathematics (STEM) workforce is important to the US economy. Yet, because of policymakers’ long-standing focus on STEM workers who have a bachelor’s degree or higher, the need for workers whose jobs require significant STEM skills but not 4-year degrees has largely been overlooked (NSB, 2015; NSB, 2019). Referred to as the “blue-collar STEM,” “middle skilled,” or “skilled technical” workforce (STW), workers whose education is below a bachelor’s degree compose a sizable component of the US STEM workforce. In 2011, about 26 million US jobs—20 percent of all jobs—required substantial STEM skills, and half of these jobs were available to workers without a 4-year degree (Rothwell, 2013). In 2015, nearly one-quarter of STEM jobs and 40 percent of STEM-related jobs were performed by workers with education below a bachelor’s degree (NSB, 2018b). Current projections indicate that the US workforce will have a shortfall of 3.4 million STW workers by 2022 (NASEM, 2017).
Key Findings
By 2017, about 6 years after college entry, 58 percent of 2011–12 beginning postsecondary students were working and not in school and, among these workers, 9 percent held STW jobs that required high-level technical expertise but not a bachelor’s degree.
Seventeen percent of male workers in the cohort held skilled technical workforce (STW) jobs compared with 4 percent of female workers.
Compared with workers in skilled professional workforce (SPW) jobs, which require high-level technical expertise and a bachelor’s degree, proportionally more workers in STW jobs were Hispanic, from low-income backgrounds, and had parents who did not have college education.
The median salary for workers in STW jobs was $35,900, which was higher than the median salary for all workers ($28,000) and for those in nontechnical jobs ($25,000). STW workers’ salaries did not vary with socioeconomic indicators like family income and parental education.
Compared with workers in nontechnical jobs (75 percent of the study sample), STW workers were more likely to be offered a variety of workforce benefits, to work in jobs related to their college majors or in their career paths, and to be satisfied with their jobs.
Recognizing the STW as critical to the STEM enterprise, the National Science Board (NSB) has called for building a strong STEM workforce that includes not only “traditional scientists and engineers performing research in university, government, or industry labs, but also skilled technical workers who can install, repair, debug, and build, but do not have 4-year degrees” (NSB, 2018a). In 2017, the NSB established a Skilled Technical Workforce Task Force to gather critical information on the STW. The Task Force’s policy report highlights the strong need to collect data and conduct research on the STW (NSB, 2019).
This research brief capitalizes on newly available data from the 2012/17 Beginning Postsecondary Students Longitudinal Study (BPS:12/17) to examine US undergraduates’ post-college transitions into the STW. Sponsored by the US Department of Education’s National Center for Education Statistics, BPS:12/17 is a longitudinal study of a nationally representative sample of undergraduates who entered postsecondary education for the first time in 2011–12. The study followed cohort members from 2011 through 2017, gathering information about students’ demographic backgrounds, enrollment characteristics, academic and social experiences in college, postsecondary education completion, and employment during and after college. Thus far, national data with comprehensive information on the STW are limited; BPS provides the only national data source with an adequate sample of sub-baccalaureate students and rich information about their postsecondary and postcollegiate employment experiences. It is worth noting that BPS:12/17 allows analyses of students’ participation in the STW but cannot shed light on the size of the STW or the demand and supply of STW workers in the labor market.
This research brief presents the results of analyses that address the following questions:
What percentage of postsecondary students entered the labor force and the STW after college, and how did STW entrance vary by student characteristics?
How did STW and non-STW workers differ in terms of demographic and educational characteristics?
How did STW and non-STW workers differ in terms of employment outcomes?
Defining STW Jobs
This report defines STW jobs as a collection of occupations requiring high-level knowledge in a technical field but not necessarily a bachelor’s degree for entry. Although this definition provides a conceptual framework for STW research, identifying STW jobs precisely is challenging (Rothwell, 2015). Researchers have attempted several approaches, using wages (e.g., middle-wage jobs), occupational characteristics (e.g., middle-wage jobs that perform non-routine tasks), and educational level (e.g., jobs requiring education beyond high school but less than a bachelor’s degree) (Autor et al., 2006; Holzer, 2015; National Research Council, 2014). Although these approaches offer relatively easy ways to classify STW jobs, they lack precision. Rothwell (2015) notes that using wages to define STW jobs may include unskilled workers who are paid well because of union contracts and exclude skilled workers who may be subject to downward wage trends as a result of market competition and technological changes. Using educational requirements may also include unskilled workers because jobs with the same educational requirements may encompass a wide spectrum of technical skills.
To identify STW jobs more precisely, Rothwell (2015) suggested including a direct measure of the skill required in jobs using information from the Knowledge and Education Surveys of the Department of Labor’s Occupational Information Network (O*NET) to identify jobs that meet the two STW criteria: (1) they require high-level knowledge in a technical domain, and (2) they do not require a bachelor’s degree.
O*NET is the nation's primary source of occupational information, and its database contains comprehensive information on the training, education, experience, and skill-related work requirements for every occupation in the US economy. The O*NET Knowledge Survey asks workers to rate the level of knowledge required to perform their jobs across 33 domains (e.g., mathematics, biology, design). Using the domain of mathematics as an illustration, the O*NET Knowledge Survey asks workers, “What level of knowledge of MATHEMATICS is needed to perform your current job?” On a 1–7 scale, the survey provides examples for the kinds of knowledge that would score a 1, 4, and 6: “Adding two numbers” would rate a 1, “Analyzing data to determine areas with the highest sales” would rate a 4, and “Deriving a complex mathematical equation” would rate a 6. Based on workers’ responses, O*NET calculates an average mathematics knowledge score required for every occupation.
To identify STW jobs in O*NET, Rothwell (2015) first distinguished jobs requiring technical knowledge from those requiring nontechnical knowledge (e.g., writing, foreign language). Rothwell defined technical knowledge as that falling within any of 14 of the 33 domains.1 These 14 knowledge domains are biology, building and construction, chemistry, computers and electronics, design, economics and accounting, engineering and technology, food production, mathematics, mechanical, medicine and dentistry, physics, production and processing, and telecommunications. Rothwell then operationally defined a STW job as one that scores 4.5 or higher on the knowledge requirement scale in at least one of these 14 knowledge domains. Finally, to distinguish skilled technical work from skilled professional work, Rothwell used data from the O*NET Education Survey to restrict STW jobs further to those in which the majority of the workers (>50 percent) report that their jobs do not require a bachelor’s degree.
Although Rothwell’s method is not perfect (e.g., workers’ skill evaluations may be subjective), it has the advantage of categorizing jobs by their skill requirements rather than the characteristics of workers (e.g., wages and education) in those jobs. After reviewing several approaches to identifying STW occupations, the National Center for Science and Engineering Statistics (NCSES) chose to build on Rothwell's method and applied it in the 2020 edition of the Science and Engineering Indicators report that NCSES prepared on behalf of the NSB.
Likewise, we used Rothwell’s method to identify STW jobs in this brief. We first identified jobs that require high-level knowledge (scoring higher than 4.5 on the O*NET knowledge scale of 1 to 7) in at least one of the 14 knowledge domains described above. Once identified, these jobs were then classified into two categories based on their educational requirements: (1) skilled technical jobs, which do not require a bachelor’s degree for entry (i.e., jobs in which less than half of workers report that their jobs do not require a 4-year degree), and we refer to workers in these jobs as the STW; and (2) skilled professional jobs, which require a bachelor’s degree for entry (i.e., jobs in which at least half of workers report that their jobs require at least a 4-year degree), and we refer to workers in these jobs as the skilled professional workforce (SPW). For comparison purposes, we also provide estimates for all other remaining occupations that do not fall into STW and SPW categories. It is important to note that although STW jobs do not require a bachelor’s degree for entry, persons with a 4-year degree may work in STW jobs because of labor market conditions and family and personal reasons. Likewise, although SPW jobs require a bachelor’s degree for entry, persons without a 4-year degree may work in SPW jobs. Our analyses of workers in STW and SPW jobs include individuals with all levels of educational attainment up to a bachelor’s degree.2
Entering the STW After College
In 2017, about 6 years after college entry, 58 percent of postsecondary students beginning in 2011–12 were working and not enrolled in school, 15 percent were both working and enrolled, and the remaining 27 percent were not working regardless of enrollment status (Figure 1).
Figure 1.
44466Employment and enrollment status of 2011–12 beginning postsecondary students in 2017 and, among students who were working and not enrolled, percentage working in STW, SPW, and other jobs
Note: STW = skilled technical workforce; SPW = skilled professional workforce. Detail may not sum to totals because of rounding.
Source: US Department of Education, National Center for Education Statistics, 2012/17 Beginning Postsecondary Students Longitudinal Study (BPS:12/17).
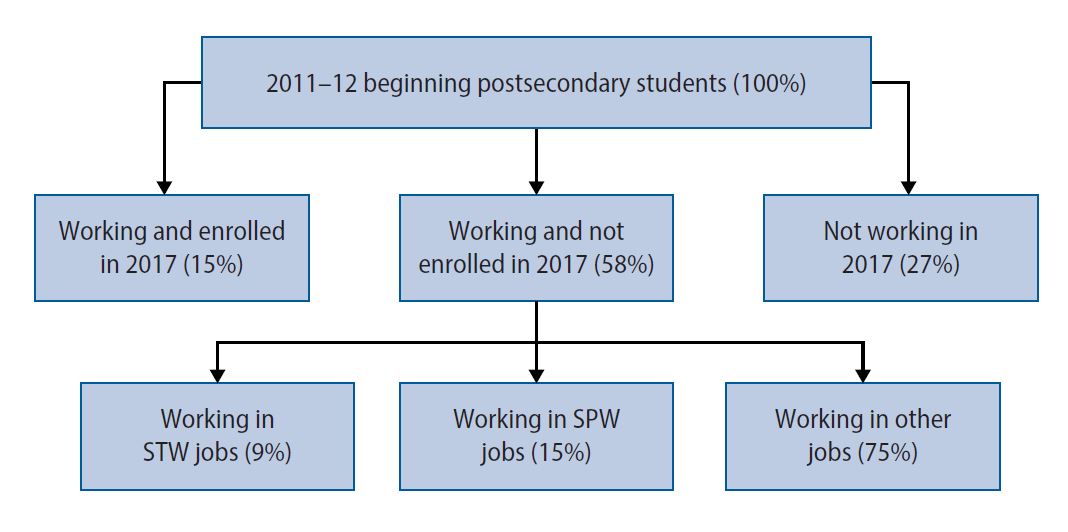
Because BPS:12/17 has full employment information only on respondents’ 2017 jobs, the remaining analysis is restricted to the 58 percent of students who were working and not enrolled in 2017, regardless of whether they earned a credential or the level of the credential earned.3 Among this targeted group (frequently referred to as workers throughout), 9 percent held STW jobs requiring high-level technical expertise but not a bachelor’s degree, and 15 percent held SPW jobs requiring both high-level technical expertise and a bachelor’s degree. The majority, 75 percent, held jobs that did not require high-level technical expertise.
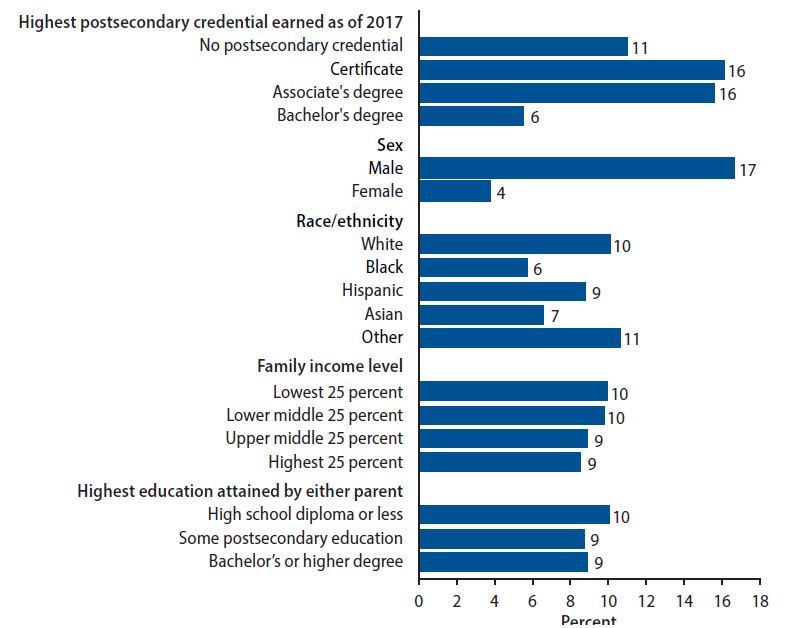
Certificate and associate’s degree earners and non-degree earners were more likely than bachelor’s degree earners to enter the STW (11 to 16 percent vs. 6 percent) (Figure 2).4 The most striking difference in the percentages of students entering the STW was between men and women: men entered STW jobs at four times the rate of women (17 percent vs. 4 percent). White and Hispanic persons entered STW jobs at a rate of 9–10 percent, higher than the 6 percent of Black persons. The rate of entering STW jobs did not vary by family income and parental education.
Figure 2.
44469Among 2011–12 beginning postsecondary students who were working and not enrolled in 2017, percentage working in STW jobs, by selected characteristics
Note: STW = skilled technical workforce.
Source: US Department of Education, National Center for Education Statistics, 2012/17 Beginning Postsecondary Students Longitudinal Study (BPS:12/17).
Differences in Demographic and Educational Characteristics Between STW and Non-STW Workers
Demographic characteristics. The majority of STW and SPW workers were men, whereas the majority of other workers were women (Table 1). The gender balance was more skewed among STW workers than among SPW workers: 76 percent of STW workers were men, and 24 percent were women; in comparison, 54 percent of SPW workers were men, and 46 percent were women. When compared with SPW workers, STW workers had a larger share of people who were Hispanic, from low-income backgrounds, and whose parents had a high school education or less.
Table 1.
44463Demographic composition of STW, SPW, and other workers
Note: STW = skilled technical workforce; SPW = skilled professional workforce.
Source: US Department of Education, National Center for Education Statistics, 2012/17 Beginning Postsecondary Students Longitudinal Study (BPS:12/17).
Educational characteristics. Because SPW jobs typically require a bachelor’s degree for entry, 81 percent of SPW workers held a bachelor’s degree (Table 2).5 In comparison, 29 percent of STW workers held a bachelor’s degree, and the other 71 percent had a certificate, associate’s degree, or no postsecondary credential. Other workers (non-STW and non-SPW) fell in between: 44 percent had a bachelor’s degree, and 56 percent had a certificate, associate’s degree, or no postsecondary credential.
Looking at the last institution attended, 41 percent of STW workers last attended public 2-year institutions, considerably higher than the 15 percent of SPW workers and 32 percent of other workers who last attended these institutions. On the other hand, 41 percent of STW workers last attended a public or private nonprofit 4-year institution, considerably lower than the 80 percent of SPW workers and 53 percent of other workers who last attended these institutions. Relatively more STW and SPW workers last majored in STEM (29 percent and 37 percent, respectively) than other workers (13 percent). Relatively more STW workers last majored in manufacturing, construction, repair, transportation, military technology, or protective services (18 percent) than SPW (2 percent) and other workers (6 percent).
Table 2.
44464Educational characteristics of STW, SPW, and other workers
*Includes public less-than-2-year, private nonprofit 2-year, and private nonprofit less-than-2-year institutions.
†Major fields not shown in the table include education; humanities; personal and consumer services; public, legal, and social services; architecture, design, and applied arts; communications; and general studies. The percentages of STW, SPW, and other workers who had these majors were all below 10 percent.
‡STEM includes mathematics, biological/life/agricultural sciences, physical sciences, science technology, engineering and engineering technology, and computer and information sciences.
§Includes manufacturing, construction, repair, transportation, military technology, and protective services.
Note: STW = skilled technical workforce; SPW = skilled professional workforce.
Source: US Department of Education, National Center for Education Statistics, 2012/17 Beginning Postsecondary Students Longitudinal Study (BPS:12/17).
Differences in Employment Outcomes Between STW and Non-STW Workers
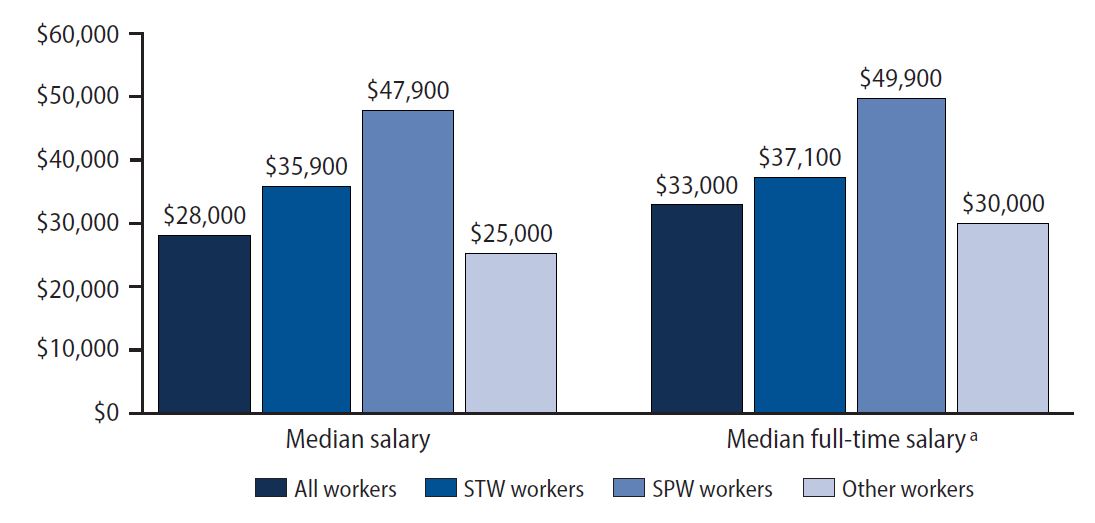
Salary. The median salary of all workers in the 2011–12 BPS cohort was $28,000 (Figure 3). The median salary of STW workers ($35,900) and SPW workers ($47,900) was higher than the median salary of all workers ($28,000) and workers in nontechnical jobs ($25,000). These gaps were also observed among full-time workers.
Figure 3.
44468Median annual salary of all, STW, SPW, and other workers in 2017
1Median annual salary of those who reported working at least 35 hours per week.
Note: STW = skilled technical workforce; SPW = skilled professional workforce. Salaries are rounded to the nearest $100.
Source: US Department of Education, National Center for Education Statistics, 2012/17 Beginning Postsecondary Students Longitudinal Study (BPS:12/17).
Regardless of job category (STW, SPW, or other), men earned more than women (Table 3). White persons generally earned more than Black and Hispanic persons, but the White–Hispanic salary gap was not observed among STW workers. Salary did not vary by family income and parental education among STW workers but did vary among SPW and other workers—SPW and other workers from families with higher income and higher parental education earned more than their SPW and other worker peers from families with lower income and lower parental educational attainment levels.
Table 3.
44465Median annual salary of STW, SPW, and other workers in 2017, by selected characteristics
Note: STW = skilled technical workforce; SPW = skilled professional workforce. Salaries are rounded to the nearest $100.
Source: US Department of Education, National Center for Education Statistics, 2012/17 Beginning Postsecondary Students Longitudinal Study (BPS:12/17).
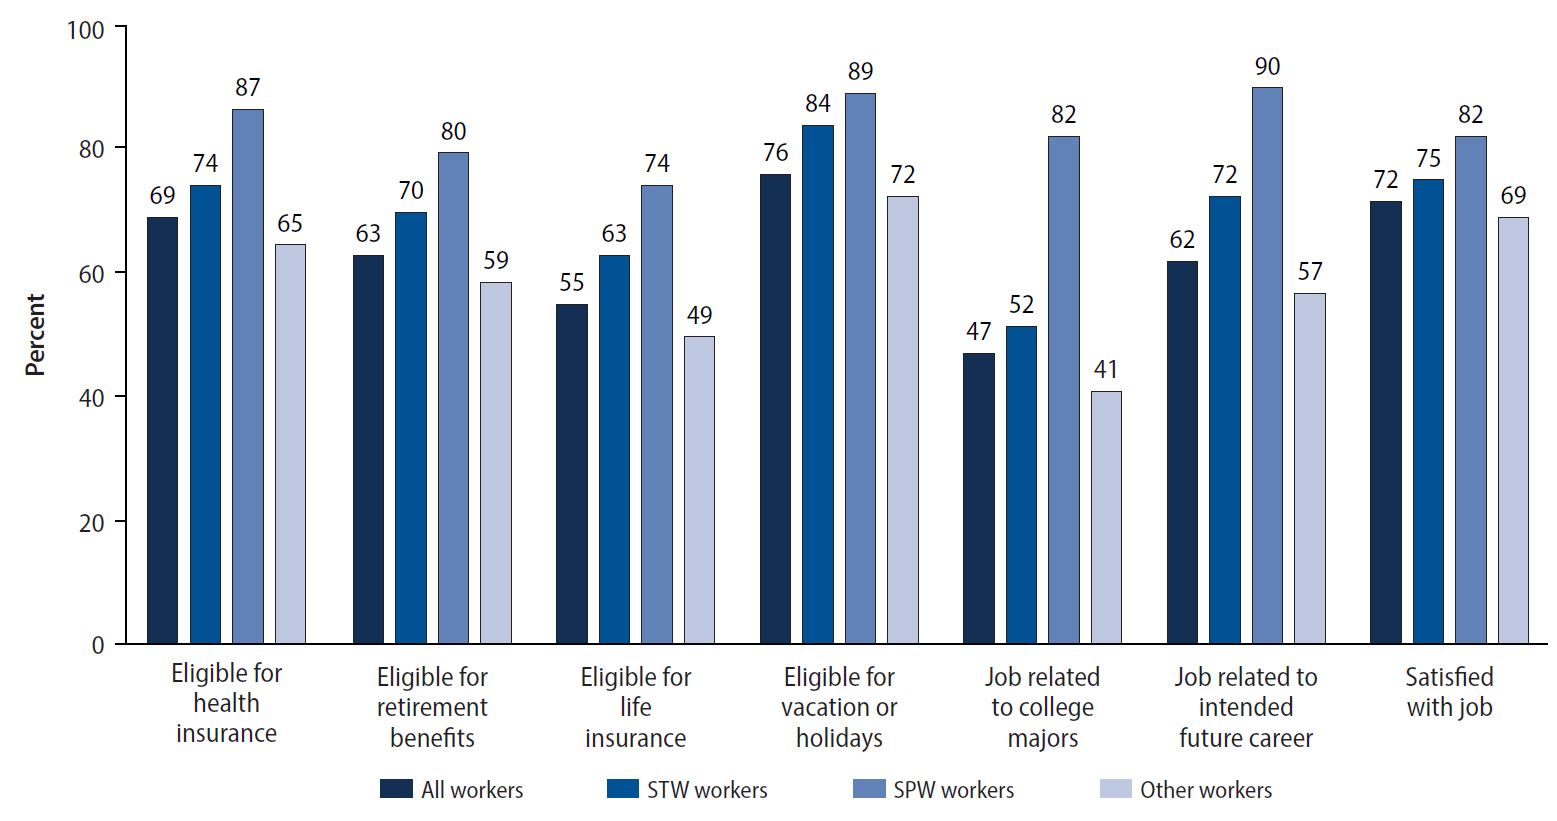
Job benefits. Overall, 69 percent of all workers in the 2011–12 BPS cohort reported that they were eligible for health insurance through their job, 63 percent were eligible for retirement benefits, 55 percent were eligible for life insurance, and 76 percent were eligible for vacation or holidays (Figure 4). SPW workers were most likely to report eligibility for these benefits. STW workers came in a close second, whereas other workers were least likely to report eligibility status for these benefits.
Job-major relatedness and job satisfaction. When asked whether their job was related to their college majors, 52 percent of STW workers indicated they were, higher than the percentage for other workers (41 percent) but lower than the percentage for SPW workers (82 percent) (Figure 4). When asked whether their job was related to their intended future careers, 72 percent of STW workers indicated they were, again higher than the percentage for other workers (57 percent) but lower than the percentage for SPW workers (90 percent). Finally, job satisfaction was higher among SPW workers (82 percent) and STW workers (75 percent) than among other workers (69 percent).
Figure 4.
44467Percentage of all, STW, SPW, and other workers who reported selected characteristics of their employment in 2017
Note: STW = skilled technical workforce; SPW = skilled professional workforce.
Source: US Department of Education, National Center for Education Statistics, 2012/17 Beginning Postsecondary Students Longitudinal Study (BPS:12/17).
Implications for Future Research
This report examines the characteristics and employment outcomes of 2011–12 beginning postsecondary students who joined the STW after leaving college. The results reveal four key insights into the STW:
Compared with their peers in nontechnical jobs, workers who had begun postsecondary education in 2011–12 and worked in STW jobs in 2017 had more positive employment outcomes. They earned higher salaries and were more likely to be offered a variety of workforce benefits, to work in jobs related to their college majors or in their career paths, and to be satisfied with their jobs.
Pay was more equitable among STW workers. Median salaries of STW workers did not vary with such socioeconomic indicators as family income and parental education. White–Hispanic salary gaps were not observed among STW workers. However, median salaries among both SPW and nontechnical workers did vary with these variables.
STW jobs attracted diverse populations. Compared with SPW workers, relatively more STW workers were Hispanic, came from low-income backgrounds, and had parents without any college education.
Among STW workers, 71 percent entered the job market with education below a bachelor’s degree, and 41 percent last attended a public 2-year college, highlighting the important role that community colleges and sub-baccalaureate programs play in developing the STW.
The STW is an essential component of the STEM workforce but has received less attention among policymakers. The promising findings regarding STW employment demonstrate the potential value of less expensive and more widely available sub-baccalaureate education pathways that lead to these jobs. In addition, the findings suggest that Black and Hispanic students and other STEM-underrepresented groups should be encouraged to enter STW pathways because STW jobs offer the promise of higher pay, better benefits, and more job satisfaction when compared with nontechnical jobs. Given these positive outcomes, it is concerning that far fewer women than men are entering the STW. Policy efforts should focus on encouraging women to follow pathways that will lead them into the STW.
The findings also raise many questions for future research. For example, what types of training have STW workers had in 2- and 4-year colleges? What specific knowledge do they possess that prepares them for STW careers? What educational paths have STW workers taken? How many students start with STW jobs in mind and focus their studies toward that goal? How many students find their way to STW jobs less efficiently (e.g., starting in an unrelated major, dropping out, and then returning)? What can secondary schools and postsecondary institutions do to direct students into the appropriate paths to the STW and guide them through completion as quickly and cheaply as possible? Finally, what roles do employers play in preparing workers to enter the STW? This report represents a first step in better understanding this vital segment of the US workforce. We plan to extend this work with in-depth analyses of educational pathways undertaken by the 2011–12 cohort. By digging into rich data (including soon-to-be-available postsecondary transcripts) from BPS:12/17, we hope to gain a deeper, more fine-grained understanding of the educational trajectories of STW workers.
Acknowledgments
The authors thank Robin R. Henke (RTI), Amy Burke (NSF), and an anonymous reviewer for their constructive comments on prior versions of this report, Joanna Wu (RTI) for programming support, and Erin Williams and Emilia Peytcheva (RTI) for editing. Funding for this brief was provided by RTI International through a 2019 Professional Development Award.