Insights


An estimated 72,000 Americans died due to drug overdose in 2017, with opioids responsible for over two-thirds of those deaths. Although the opioid crisis is clearly a problem, what is less clear is how to best confront the crisis with interventions that target specific groups of people and are also evidence-based.
As a part of the 2018 International Conference on Social Computing, Behavioral-Cultural Modeling, & Prediction and Behavior Representation in Modeling and Simulation (SBP-BRiMS), we were challenged to confront the issue of opioid abuse using openly available data. The data represented overdoses in Cincinnati, a city at the center of the opioid crisis. With Savannah Bates, (a PhD student from North Carolina State University) and visiting Fulbright Scholar Vasily Leonenko, we developed winning models to predict patterns between opioid misuse and overdose.
Uncovering local patterns between opioid use disorder and overdose
In order to win the challenge, our model used Emergency Medical Services (EMS) data to map places where opioid overdoses occurred, and we consulted publicly available information from the National Survey on Drug Use and Health (NSDUH)—a survey RTI has conducted since 1988—to estimate the degree of opioid misuse in that area. We then linked these data with the RTI U.S. Synthetic Household Population™ data, which includes individual- and household-level representations of the U.S. population.
For this specific model, the synthetic population provided a statistically accurate representation of Cincinnati’s complete individual and household populations, including locations and descriptive sociodemographic attributes. As a part of the study, which won the SBP-BRiMS challenge, we developed a heat map of geographic areas with differing ratios of EMS calls for opioid overdoses per predicted misuser. Since we might expect there to be more EMS calls in areas with more people who misuse opioids, areas with higher EMS-to-misuser ratios were of interest to us. These areas had greater than expected overdose rates and indicated potential problem areas.
EMS Calls Per Opioid Misusers Map to Commercial Areas in Cincinnati
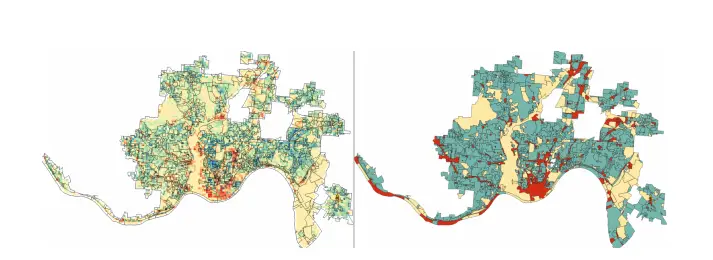
On the left, a heat map of the ratio of EMS calls per misuser is plotted with the Cincinnati zoning borders. On the right, a simplified zoning map of Cincinnati is shown. Red areas represent commercial zones, yellow represent industrial areas and parks, and blue represents residential areas.
The analysis revealed some interesting trends. Areas with higher EMS to user ratios tended to coincide with commercial areas; areas with lower ratios coincided more often with residential zones, with secluded commercial zones being associated with higher rates of opioid misuse and overdose. Certain fast food restaurant chains were often located within these high-risk areas, coinciding with stories in the news of opioid activity within fast food restaurants and their growing reputations as locations for buying, selling, and using illegal drugs.
Geographically targeting opioid interventions and treatment
To design effective interventions and understand substance misuse, we must observe the behavioral patterns of people who misuse drugs and understand both the demographic and geographic patterns between misuse and overdose.
All of this can be a challenge because behavior patterns differ for opioid use compared to other narcotics. This is because of how opioids function and how the body processes them. The physical withdrawal symptoms of opioids are so powerful that people will often use and overdose near the location where they bought the drug—whereas with crack cocaine or meth, for example, the user will often wait to return home before taking the drug.
This information can be used to design and implement targeted interventions to treat and prevent opioid overdose. For example, to help prevent overdose events in Cincinnati, interventions should be focused on commercial zones. However, education and community outreach programs aimed at preventing and reducing opioid misuse would be most effective in residential areas where our model predicts that a lot of people who misuse opioids live.
Driven by access to large volumes of data from multiple sources, we can study these types of phenomena at higher resolutions; what previously could be done only at the county, state, or national level can now be done on the very local—even individual—level. At the same time, the Synthetic Population modeling approach ensures that no personal information could be deducted from the study.
Currently, we can’t generalize these trends to other cities and towns. The opioid crisis varies from place to place and evolves over time, so models like ours can uncover location-specific patterns in opioid misuse and overdose. In turn, these data can help us focus our efforts to reduce opioid overdose and misuse and ensure that interventions target the best areas and audiences.
Should you be interested in a similar study of your town or city, please contact us for more information.
Disclaimer: This piece was written by James Rineer (Director, Geospatial Science and Technology) and Georgiy Bobashev (Senior Fellow, Data Science) to share perspectives on a topic of interest. Expression of opinions within are those of the author or authors.


