Skip to Main Content

RTI uses cookies to offer you the best experience online. By and clicking “accept” on this website, you opt in and you agree to the use of cookies. If you would like to know more about how RTI uses cookies and how to manage them please view our Privacy Policy here. You can “opt out” or change your mind by visiting: http://optout.aboutads.info/. Click “accept” to agree.

Accept
RTI International
  • About
    • Office Locations
    • Executive Leadership
    • Corporate Governance
    • Partner with Us
      • U.S. Government
      • Clients and Funding Agencies
      • Industry and Commercial Clients
      • Foundations and Associations
      • Bilateral Agencies and Multilateral Banks
      • Universities and Academic Research Institutions
      • Suppliers and Small Businesses
    • Commitment to Quality
      • RTI's Client Listening Program
    • Ethics and Human Research Protection
    • Living Our Mission
    • Veteran Opportunities at RTI

    About

  • Practice Areas
    • Health
      • Public Health and Well-Being
      • Health Care Transformation
      • Behavioral Health
      • Health Behavior Change
      • Precision Medicine
      • RTI Health Solutions (RTI-HS)
      • RTI Center for Community Health Evaluation and Economics Research
      • Health Equity
      • RTI Health Advance
    • Transformative Research Unit for Equity​
      • Equity Capacity Building Hub
      • Social and Economic Justice Research Collaborative
      • Narrative Research and Community Engagement Lab
    • Education and Workforce Development
      • Early Childhood
      • K-12 Education
      • Postsecondary Education
      • Career and Adult Education and Workforce Development
      • Education Policy, Systems, and Governance
      • Education Research Methodologies
      • Education Technologies
    • International Development
      • Energy for Development
      • Environment
      • Global Food Security, Agriculture, and Nutrition
      • Global Health
      • International Education
      • Monitoring, Evaluation, Research, Learning, and Adapting (MERLA)
      • Youth and Economic Opportunity
      • Building Resilience Against COVID-19 in Developing Countries
      • Water, Sanitation, and Hygiene (WASH)
      • RTI Center for Governance
    • Climate Change
      • Clean Energy Technology and Renewables
      • Climate Finance
      • Climate Justice and Equity
      • Climate Planning, Preparedness and Resilience
      • Climate Policy
      • Climate Vulnerability, Adaptation, and Mitigation
      • Economic Impacts of Climate Change
    • Water
      • Food-Energy-Water Nexus
      • Water Quality
      • WASH (Water, Sanitation, Hygiene)
      • Water Resources Management
    • Energy Research
      • Carbon Capture and Utilization
      • Biomass Conversion
      • Natural Gas
      • Energy Efficiency
      • Industrial Water
      • Syngas Processing
    • Environmental Sciences
      • Air Quality
      • RTI Center for Water Resources
      • Urban Sustainability
      • Toxics
      • Building Resiliency in the FEW Nexus
      • Climate Change Sciences and Analysis
      • Environmental Policy
      • Environmental Justice
      • Sustainable Materials & Waste Management Solutions
    • Justice Research and Policy
      • RTI Center for Community Safety and Crime Prevention
      • RTI Center for Policing Research and Investigative Science
      • Child Well-Being and Family Strengthening
      • RTI Center for Forensic Sciences
    • Food Security and Agriculture
      • Market Systems Strengthening
      • Food Safety
      • Food and Nutrition
      • Global Food Security, Agriculture, and Nutrition
      • Climate-Smart Agriculture
      • Agricultural Innovation
      • Obesity Prevention
    • Innovation Ecosystems
      • Innovation Advising
      • Innovation for Economic Growth
      • Innovation for Emerging and Developing Economies
      • Innovation for Organizations
      • Research, Technology, and Innovation Policy
      • Technology Acceleration
    • Military Support
      • Military Behavioral Health
      • Military Health and Human Performance
      • Military Sexual Assault, Harassment, and Domestic Violence Prevention
      • Wearable Sensor Technologies
      • Military Health System Transformation

    Practice Areas

  • Services + Capabilities
    • Surveys and Data Collection
      • Survey Design
      • Instrument Development
      • Survey Methodologies
      • Data Collection
      • Establishment Surveys
      • Health Registries
      • Data Analysis and Reporting
      • Research Operations Center
    • Statistics and Data Science
      • Survey Statistics
      • Environmental Statistics
      • Coordinating Centers for Multisite Studies
      • Analysis and Design of Complex Data
      • Biostatistics
      • RTI Center for Data Science
    • Evaluation, Assessment and Analysis
      • Evaluation Design and Execution
      • Advanced Qualitative, Quantitative, and Mixed Methods
      • Evaluation, Monitoring, and Assessment
      • Economic Analysis
      • Evaluating Communication Interventions and Campaigns
      • Evidence Synthesis for Policy and Practice
      • Risk Assessment and Prediction
    • Program Design and Implementation
      • Systems Strengthening and Scaling
      • Capacity Assessment and Building
      • Policy Reform Support
      • Curriculum and Teacher Professional Development
      • Interventions and Prevention Programs
      • Implementation Science
    • Digital Solutions for Social Impact
      • Human-Centered Design of Digital Solutions
      • Digital Product Development
      • Digital Communication Campaigns
      • Digital Data Analytics
    • Research Technologies
      • Survey Technologies
      • Data Management and Decision Support Systems
      • Geospatial Science, Technology, and Visualization
      • ICT for Limited-Resource Settings
      • Mobile Applications
      • Web Applications
      • Bioinformatics
      • Interactive Computing
    • Drug Discovery and Development
      • Medicinal Chemistry
      • Molecular Design and Cheminformatics
      • Behavioral Pharmacology
      • Drug Metabolism and Pharmacokinetics (DMPK)
      • In Vitro Pharmacology, Bioassay Development, and High-Throughput Screening (HTS)
      • Isotope Labeling
      • Regulatory Consulting and Support for Medical Products
    • Analytical Laboratory Sciences
      • Bioanalytical and Toxicology Research
      • Forensic Sciences
      • Physicochemical Characterizations
      • Metabolomics
      • Proficiency Testing and Reference Materials
      • Microbiology
      • Analytical Chemistry and Pharmaceutics
    • Engineering & Technology R&D
      • Biomedical Technologies
      • Decarbonization Sciences
      • Environmental Exposure & Protection
      • Materials & Environment
      • Sustainable Energy Solutions

    Services + Capabilities

  • Centers
    • RTI Center for Advanced Methods Development
    • RTI Center for Communication Science
      • Communication Research
      • Communication Design
      • Communication Delivery
    • RTI Center for Data Science
    • RTI Center for Education Services
      • Teaching and Learning
      • Education Leadership
      • Peer Learning Networks
      • Strategic Consulting
    • RTI Center for Forensic Sciences
    • RTI Center for Global Noncommunicable Diseases
      • Program Financing & Economics for NCDs
      • Health Systems Strengthening for NCDs
      • Communication Science and Behavior Change for NCDs
      • Implementation Science for NCDs
    • RTI GenOmics, Bioinformatics, and Translational Research Center
      • Disability Studies
      • Ethics
      • Newborn Screening
    • RTI Center for Water Resources
      • Water Resources Sectors
      • Water Resources Services
      • Water Resources Tools
    • RTI Center for Governance
    • RTI Global Gender Center
    • North Carolina Center for Optimizing Military Performance
    • NCCU-RTI Center for Applied Research in Environmental Sciences
    • RTI Center for Climate Solutions

    Centers

  • Impact
    • Newsroom
    • Insights Blog
    • Events
    • Publications
    • RTI Press
      • About the RTI Press
      • Instructions for Authors
      • RTI Press Collections
    • Projects
    • Global Reach
      • Asia
      • Eastern Europe and Central Asia
      • RTI International India
      • Africa
      • Middle East and North Africa (MENA)
      • Latin America and the Caribbean (LAC)

    Impact

  • Experts
    • Our Experts
    • In-Depth With Our Experts
    • Related News
    • Experts In the Media
    • RTI Fellow Program

    Experts

  • Emerging Issues
    • COVID-19 Research
    • Artificial Intelligence
    • Global Health Security
    • Cannabis Research
    • Opioid Research
      • Interventions for Opioid Use Disorders
      • Preventing Opioid Misuse and Overdose
      • Treating Opioid Use Disorders
    • Policing Research and Investigative Science
    • Drone Research and Application
    • E-cigarette Research
    • Zika Virus Research
    • Integrated Governance

    Emerging Issues

  • COVID-19 Research + Response
  • Global Reach
  • Insights Blog
  • Newsroom
  • RTI Press
  • Publications
  • Partner With Us
  • Careers
  • Facebook IconTwitter IconInstagram IconYouTube IconLinkedin Icon
  • Home
  • Impact
  • RTI Press
  • People with colorectal cancer in SEER-Medicare

People with colorectal cancer in SEER-Medicare

Part D uptake, costs, and outcomes

By Lisa M. Lines, Florence K L Tangka, Sonja Hoover, Sujha Subramanian.

May 2020 Open Access Peer Reviewed

DOI: 10.3768/rtipress.2020.rr.0037.2005

Check for Updates Download PDF
Lines, L. M., Tangka, F. K. L., Hoover, S., & Subramanian, S. (2020). People with colorectal cancer in SEER-Medicare: Part D uptake, costs, and outcomes. RTI Press. RTI Press Research Report No. RR-0037-2005 https://doi.org/10.3768/rtipress.2020.rr.0037.2005
Copy citation
Share
  • Share on Facebook
  • Share on Twitter
  • Share on Linkedin
  • Email

Abstract

Limited information exists about enrollment in Part D prescription coverage by Medicare beneficiaries with cancer. Part D coverage may increase access to medicines. This study evaluated patterns of Part D uptake and costs and assessed the effects of coverage on hospitalizations and emergency department (ED) use among people with colorectal cancer (CRC). We analyzed Surveillance, Epidemiology, and End Results (SEER)–Medicare linked data on fee-for-service (FFS) Medicare beneficiaries with at least 36 months of follow-up who were diagnosed with CRC at any point from January 2007 through December 2010, and a matched cohort of beneficiaries without cancer. Dual (Medicare/Medicaid) enrollees were excluded because they are automatically enrolled in Part D. Among beneficiaries with CRC (n = 12,774), 39 percent had complete Part D coverage, defined as coverage in the diagnosis year and 2 subsequent years; the rate was 38 percent in the matched comparison cohort (P = .119). Among those with complete Part D coverage, there was no significant difference in annual prescription drug costs between people with CRC ($3,157, 95% confidence interval [CI]: $3,098–$3,216) and without ($3,113, 95% CI: $3,054–$3,172). Among people with CRC, odds of ED use ranged from unchanged to marginally higher for those with no or partial Part D coverage, (adjusted odds ratio: 1.09, 95% CI: 1.00–1.18), compared with those with complete Part D coverage. Lack of continuous Part D coverage was associated with more ED use among Medicare FFS beneficiaries with CRC in 2007–2013. Among people with Part D coverage, prescription drug costs varied little between those with CRC and matched beneficiaries without cancer.

Creative Commons © 2023 RTI International. This work is licensed under a Creative Commons Attribution-NonCommercial-NoDerivatives 4.0 International License.

Contents

  • Introduction
  • Methods
    • Sample Selection and Cohort Matching
      • Measures
        • Statistical Analysis
        • Results
          • Discussion
          • Acknowledgments
          • References

          People with Colorectal Cancer in SEER-Medicare: Part D Uptake, Costs, and Outcomes

          By Lisa M.LinesFlorence K. L.TangkaSonjaHooverSujhaSubramanian

          Introduction

          Colorectal cancer (CRC) is the second-most expensive cancer to treat, at an estimated projected annual cost in the United States of $19 to $26 billion in 2020.1 The high costs and substantial cost-sharing associated with cancer medicines may put Medicare beneficiaries treated for CRC at risk for delaying or discontinuing their therapies, possibly increasing other health care use, such as inpatient admissions or emergency department (ED) visits.2,3

          In January 2006, with US drug prices continuing to climb ever higher, the Centers for Medicare and Medicaid Services implemented the optional Medicare prescription drug benefit (Part D) program to offer subsidized drug plans to all Medicare beneficiaries.4 Before Part D, Medicare beneficiaries with cancer faced substantial out-of-pocket (OOP) costs: according to data from the Medical Expenditure Panel Survey, from 1996 to 2005, 57 percent of Medicare beneficiaries over 65 years of age with cancer had annual OOP costs exceeding 10 percent of their annual income.5,6 More-recent research suggests that since Part D’s introduction, average OOP burden among Medicare beneficiaries with cancer has declined by 43%.7

          Published data from the National Cancer Institute’s (NCI’s) Surveillance, Epidemiology, and End Results (SEER)-Medicare program indicate that the proportion of Medicare fee-for-service (FFS) beneficiaries with CRC who were covered by the Part D program during the calendar year after diagnosis ranged from 55 percent in 2007 to 71 percent in 2013; about 57 percent to 70 percent of Medicare FFS beneficiaries without cancer were enrolled in Part D during the same period.8 Those who elect not to enroll in Part D initially can avoid paying a late enrollment penalty for subsequent Part D enrollment by maintaining “creditable coverage” for prescription drugs (meaning coverage from another source, such as a current or former employer or union, that is expected to pay at least as much as the standard Medicare prescription drug coverage, on average).9

          To date, few researchers have studied the impact of Part D coverage on costs or outcomes among people with cancer.2,10,11 Research not specific to people with cancer has found that Part D has reduced OOP costs4 and mortality;12,13 decreased hospital admissions, overall resource use, and total Medicare costs;13,14 and increased use of prescription medicines4,14,15—all while keeping monthly premiums and program costs below projections16 and receiving high patient experience ratings.11

          The objective of this study was to evaluate patterns of Part D uptake and costs and to understand the effects of coverage on inpatient stays and ED use among a cohort of individuals diagnosed with CRC in the United States from 2007 through 2010 and matched beneficiaries without cancer. We evaluated the following research questions: (1) What proportion of beneficiaries with and without CRC had Part D coverage during this time period, and how did this change over time? (2) How did Part D expenditures compare between Medicare beneficiaries with and without CRC? (3) Among people with CRC, was Part D coverage associated with any differences in the occurrence or volume of inpatient admissions or ED use during the initial treatment phase?

          Methods

          We used the most-recent data available at the time of our study, which covers individuals diagnosed from January 2007 through December 2010 and followed through December 2013. We used cancer registry data from the SEER database linked with Medicare claims and enrollment data (SEER-Medicare). SEER-Medicare data have been used in more than 1,600 peer-reviewed studies since 1993.17 The data also include cancer stage, which is difficult to infer from claims data alone, and which is often a major driver of costs and clinical outcomes.18

          Sample Selection and Cohort Matching

          We included continuously enrolled Medicare FFS beneficiaries aged 65 years and older at baseline who resided in a SEER area and had at least 36 months of follow-up. Note that although Part D plans are also available to Medicare Advantage (MA) enrollees, SEER-Medicare data only include FFS beneficiaries. The cancer cohort included individuals who were diagnosed with incident CRC (defined using International Classification of Diseases for Oncology, Third Edition, site codes C180–C189, C199, C209, and C260). Although the Part D program began in 2006, reliable Part D data reporting in the SEER-Medicare data set began in 2007. Thus, we included only individuals diagnosed from January 2007 through December 2010 to ensure at least 36 full months of follow-up. The maximum follow-up time was 95 months.

          For both the cancer cohort and matched no-cancer cohort, we included those who were continuously enrolled in FFS Medicare Parts A and B for the entire study period, including at least 12 months before their diagnosis date (or index date, among people without CRC). We excluded individuals with dual (Medicare and Medicaid) coverage because they are automatically enrolled in Part D and so could not provide differential insights into enrollment trends.

          We constructed a matched comparison cohort from a 5 percent random sample of Medicare beneficiaries who had no known diagnosis of cancer and resided in SEER areas. We matched at a rate of 1:1 on sex (M, F), race (white, black, other), SEER registry area, age category (65–69, 70–74, 75–79, 80–84, and 85 or older), and NCI Comorbidity Index category (0, 1, or 2+), calculated based on inpatient and physician claims during the 12-month pre-index period using programs supplied by NCI.19 The NCI Comorbidity Index was developed specifically to analyze claims for cancer patients and excludes cancer-related morbidity.20 Comorbidity is a common matching variable in utilization studies.21,22 In this study, including comorbidity was important; otherwise, it might have confounded the association between complete Part D coverage (exposure) and different kinds of utilization (outcome measures). Each individual was matched to only one other individual, and people with cancer who could not be matched (n = 72 of 13,151 who met inclusion criteria) were dropped. The matched comparison person was assigned an index date corresponding to their match’s CRC diagnosis date, and henceforth, we refer to this as the index date for both cohorts. After matching, we examined the balance between cohorts on sociodemographic and clinical characteristics.

          Measures

          We defined the exposure variable, “complete Part D coverage,” as 12 months of coverage in the diagnosis year and each of the 2 subsequent calendar years. Because Part D enrollment is strongly associated with calendar years (rather than 12-month postindex periods), we examined trends by calendar year. The number of individuals with partial-year coverage was too small to analyze separately (less than 3 percent of the cancer cohort) and showed no clear patterns (i.e., there were no clear peaks in the distribution of the number of months of coverage among those with less than 12 months). Therefore, we divided each cohort into those with complete Part D coverage and all others. Individuals in the partial/no Part D groups had some Part D expenditures in the data, but we do not know what proportion of total drug spending the observed amount represents for those individuals. As a robustness check, we also conducted an analysis that excluded the partially enrolled individuals.

          Our outcome measures included total Part D costs, any hospitalization, the number of hospitalizations, any ED visit, and number of ED visits during the 12 months post-index, generally considered the active treatment phase for CRC patients.23 We adjusted all Part D costs to constant (2012) US dollars using the gross domestic product deflator.24

          Statistical Analysis

          We analyzed sociodemographic and clinical characteristics by cohort (CRC compared with no cancer) and group (complete Part D compared with others), using Pearson chi-squared tests to identify significant differences. We examined the proportion of people who had complete Part D coverage overall and in their pre-index year, index year, post-index year 1, and post-index year 2, separating our analysis by index year (2007 through 2010), and we tested for differences between cohorts in enrollment rates. We also tested for any trends in uptake over time using Kendall's tau (continuity corrected). Because people indexed in 2007 could not have had a pre-index year (because the program was not reporting useable data in 2006), the descriptive analysis of pre-index coverage excludes individuals indexed in 2007.

          To estimate the adjusted effects of Part D on the number of hospitalizations and ED visits in the 12-month post-index period, we first counted inpatient hospitalizations and outpatient ED visits. We modeled differences between those with and without complete Part D separately for the CRC and no-cancer cohorts. We investigated both zero-inflated and noninflated models and chose the model that was statistically preferable on the basis of likelihood ratio tests. Specifically, in the CRC cohort, we used a regular multivariable Poisson regression model; in the no-cancer cohort, we used zero-inflated Poisson to account for the large proportion of people with no hospitalizations (92 percent). To estimate the adjusted effects of complete Part D enrollment on ED use, we used negative binomial models; according to the Vuong tests, zero-inflated models were not statistically preferable. To estimate the effects of complete Part D coverage on any hospitalization or ED visit, we used logistic regression models.

          Models in the CRC cohort controlled for site (rectal vs. colon), Stage 3 or 4 (vs. 1, 2, or unstaged), comorbidity, US Census region, rural residence, female sex, age group (65–74 [reference group], 75–84, or 85+ years), race or ethnicity (indicators for black, Hispanic, or other race or ethnicity), marital status, residence in a high-poverty US Census tract (> 20 percent of households with incomes under the Federal poverty level), and diagnosis year. Models in the no-cancer cohort controlled for all the same covariates except site and stage (not applicable), marital status (not available), and neighborhood poverty (not available). We report beta coefficients, standard deviations (SDs), and P-values for the results of the negative binomial models. We report adjusted odds ratios and 95% confidence limits for the results of the logistic models. All tests were two-tailed. We defined statistical significance as P < .05 and conducted analyses in StataMP v.14.2 (StataCorp LP, College Station, Texas).

          Results

          The cohort of Medicare FFS beneficiaries with CRC included 12,774 people, of whom 39 percent had complete Part D coverage (Table 1).

          Sociodemographic and clinical characteristics by Part D enrollment among Medicare fee-for-service beneficiaries with and without colorectal cancer
          Cohort → Colorectal cancer (n = 12,774) Group level P No cancer (n = 12,774) Group level P Cohort level P
          Group → Complete Part D, %a No/partial Part D, % Complete Part D, %a No/partial Part D, %
          Complete Part D coverage 39 61 N/A 38 62 N/A .119
          Age category .003 .208 .999
             65–74 years    45    42    44    42
             75–84 years    41    43    42    43
             85+ years    15    15    14    15
          Female    58    50 <.001    61    49 <.001 .999
          Race or ethnicity <.001 <.001 .663
             White, non-Hispanic    92    89    92    89
             Black, non-Hispanic    3    6    3    6
             Hispanic, any race    1    0    1    1
             Other race, non-Hispanic    4    4    4    4
          Married    55    59 <.001    N/A    N/A    N/A    N/A
          Census tract poverty level .208    N/A    N/A    N/A    N/A
             0% to < 5%    28    29    N/A    N/A    N/A    N/A
             5% to < 10% poverty    30    29    N/A    N/A    N/A    N/A
             10% to < 20% poverty    28    27    N/A    N/A    N/A    N/A
             20% or more    14    15    N/A    N/A    N/A    N/A
             Unknown    0.2    0.2    N/A    N/A    N/A    N/A
          Rural residence    15    9 <.001    15    10 <.001    .108
          Census region at indexb <.001 <.001    .999
             Northeast    23    24    23    24
             Midwest    17    11    18    11
             South    23    24    23    24
             West    37    40    37    40
          Comorbidity category <.001 .002    .511
             0    41    45    41    45
             1    28    27    28    27
             2    16    14    16    15
             3 or more    15    15    15    14
          Stage at diagnosis .561    N/A    N/A    N/A    N/A
             In situ    4    3    N/A    N/A    N/A    N/A
             Stage 1    31    32    N/A    N/A    N/A    N/A
             Stage 2    32    33    N/A    N/A    N/A    N/A
             Stage 3    24    24    N/A    N/A    N/A    N/A
             Stage 4    5    4    N/A    N/A    N/A    N/A
             Unknown/unstaged    4    4    N/A    N/A    N/A    N/A
          N/A: not applicable/not available
          Complete Part D coverage is defined as continuous Part D coverage in the index year and 2 subsequent years.
          Excludes 16 individuals with unknown state of residence or residence in Puerto Rico/Virgin Islands

          The matched comparison cohort included 12,774 Medicare FFS beneficiaries without cancer, of whom 38 percent had complete Part D coverage (P for difference between cohorts = .119). Within both cohorts, individuals with Part D coverage differed significantly from those without complete coverage on sex, race, rurality, US Census region, and comorbidity category. Among beneficiaries with CRC, those with complete Part D coverage had a significantly different age distribution (with more enrollees in the 65–74 age category) and were less likely to be married. Among both cohorts, those with complete Part D coverage were more likely to be in the youngest age group (65–74 years), female, and white; to live in a rural location; and to live in the Midwest.

          In Figure 1, we show trends in Part D uptake by cohort and time (relative to index).

          Patterns of Part D enrollment among Medicare FFS beneficiaries with and without colorectal cancer

          a Individuals indexed/diagnosed 2008–2011.

          b Individuals indexed/diagnosed 2007–2011.

          Notes: Shown are average annual Part D coverage rates among individuals diagnosed with colorectal cancer (CRC) and matched comparison beneficiaries in the first years of the Part D program (2007–2011). Although people with CRC had slightly higher coverage rates than those without CRC across all years, we found a significant (P = 0.003) difference in cohort coverage rates only in the first year after diagnosis.

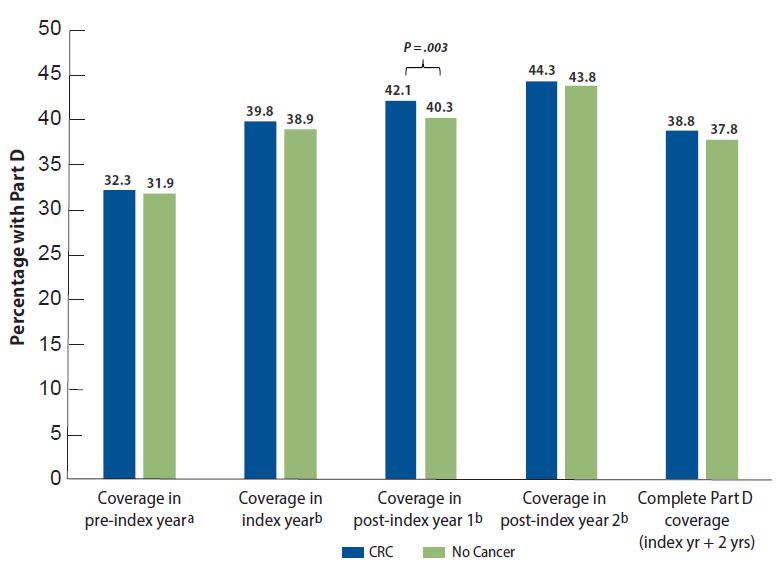
          Comparing the CRC and matched cohorts, individuals with CRC were significantly more likely to be covered by Part D in the year after being indexed or diagnosed (P = .003), but no other times showed significant differences between cohorts. Both cohorts showed significantly increased rates of Part D uptake over time (CRC: P = .004; no cancer: P = .002).

          Total 12-month Medicare Part D prescription drug costs are provided in Table 2.

          Observed prescription drug costs and healthcare utilization by Part D enrollment among Medicare fee-for-service beneficiaries with and without colorectal cancer
          Cohort Colorectal cancer No cancer
          Group Complete Part Da (n = 4,954) No or partial Part D (n = 7,820) Group-level
          P
          Complete Part D1 (n = 4,833) No or partial Part D (n = 7,941) Group-level P
          Outcomes Point est. ± SE Point est. ± SE Point est. ± SE Point est. ± SE
          Total Medicare Part D prescription drug costs, 2012 USD $3,157 ± 59 $109 ± 8 <.001 $3,113 ± 59 $116 ± 10 <.001
          Number of hospitalizations per 1,000 1,444 ± 17 1,421 ± 14 .294 146 ± 8 128 ± 6 .072
          Number of ED visits per 1,000 343 ± 9 363 ± 8 .098 67 ± 4 61 ± 3 .257
          Est. = estimate; SE = standard error.
          Complete Part D coverage defined as continuous Part D coverage in the index year and 2 subsequent years.

          Among those with complete Part D coverage, costs did not significantly differ between people with and without CRC; both groups had costs of around $3,100, as opposed to around $100 in the no/partial Part D groups. The CRC cohort had substantially higher ED and hospitalization rates per 1,000 beneficiaries than the no-cancer cohort. The hospitalization rate was nearly 10 times higher, whereas the ED rate was about 5 times higher among those with CRC. Neither cohort showed any significant difference in hospitalization or ED visit rates between those with and without Part D coverage.

          Within the CRC cohort, lack of Part D coverage was associated with no increase to slightly higher odds of an ED visit in the 12-month postindex period (adjusted odds ratio [aOR] = 1.09; 95% confidence interval = 1.00–1.18). The mean number of ED visits was 0.11 higher (P = .001) among those without Part D coverage (Table 3).

          Adjusted effects of no/partial Part D among Medicare fee-for-service beneficiaries with and without colorectal cancer
          Colorectal cancer No cancer
          Coefficient SD P Coefficient SD P
          Number of hospitalizations 0.03 0.02 .055 0.02 0.08 .827
          Number of emergency department visits 0.11 0.04 .001 0.13 0.09 .156
          aOR LCL UCL aOR LCL UCL
          Any hospitalization 1.03 0.92 1.15 1.07 0.93 1.23
          Any emergency department visit 1.09 1.00 1.18 0.97 0.82 1.14
          LCL = lower confidence limit; aOR = adjusted odds ratio; SD = standard deviation; UCL = upper confidence limit
          Note: Models adjusted the CRC cohort for site (rectal vs. colon), Stage 3 or 4 (vs. 1, 2, or unstaged), comorbidity, US Census region, rural residence, female sex, age group (65–74 [reference group], 75–84, or 85+ years), race or ethnicity (indicators for black, Hispanic, or other race or ethnicity), marital status, residence in a high-poverty US Census tract (> 20% of households with incomes under the Federal poverty level), and diagnosis year. Models in the no-cancer cohort controlled for the same covariates except site and stage (not applicable), as well as marital status and poor neighborhood (not available).

          Within the no-cancer cohort, Part D enrollment showed no significant effect on ED use. After controlling for potential confounding factors, we found no significant effects of Part D enrollment on inpatient use within either cohort. In sensitivity analyses that excluded those with partial coverage, results were nearly identical (not shown).

          Discussion

          Continuous Part D enrollment during the diagnosis year and 2 subsequent years, termed “complete Part D coverage” in this study, was associated with a reduction in ED visits among nondual Medicare FFS beneficiaries with CRC over 65 years of age during the 12 months postindex, after adjusting for potential confounding effects. Among people with complete Part D coverage, no significant differences were observed between beneficiaries with CRC and those without cancer in Part D costs. Although Part D uptake significantly increased in the year postindex, no significant differences were observed between cohorts in overall uptake of the program. Of note, our estimates of Part D uptake differ from those published by the SEER-Medicare program8 because we excluded dual enrollees from our sample, as they are automatically enrolled in Part D.25

          Both CRC and non-CRC cohorts showed statistically significant increases in Part D uptake over time, consistent with trends in the larger Medicare population. According to the Kaiser Family Foundation, the program had average annual increases of 6.5 percent from 2006 through 2013.26 Our study found that Part D enrollment increased by 9 percent over time in this sample of people with CRC and by 10 percent in the matched cohort. The differences we observe could be because we have only nondual FFS beneficiaries in our data.

          The association of Part D with slightly reduced odds of an ED visit only among people with CRC is puzzling, partly because the Part D program does not directly cover cancer treatments for this population. Although oral chemotherapy for CRC was available during the study period in the form of capecitabine (Xeloda), it was covered under Part B, and not Part D, because it is an alternative form of the infusion therapy 5-Fluorouracil.27 The rules for oral antinausea drugs are much the same.28

          Because of these coverage policies, the observed effects of Part D among people with CRC could be related to better management of medication-sensitive conditions, such as diabetes, congestive heart failure, stroke, and myocardial infarction. As shown in Table 1, those with complete Part D coverage were significantly more likely to have at least one major comorbidity. Theoretically and empirically, improved access to medicines leads to improved adherence, which helps improve blood pressure, cholesterol, and blood glucose levels, potentially preventing or delaying ED visits.10,29–31 Inpatient use in one period decreases overall ED use the next, suggesting that the intensive care provided during hospital stays may be effective at addressing clinical issues that could subsequently manifest in emergencies.32 Therefore, it is also possible that the effects among Part D enrollees in the CRC cohort are related to receiving more health care services in general.

          Other research on the effects of Part D on outcomes among people with cancer is limited. One study used Medical Expenditure Panel Survey data for 2002 through 2010 and employed a difference-in-differences design to explore the effects of Part D enrollment on OOP costs, medicine use, hospitalizations, ED visits, and outpatient visits among Medicare beneficiaries with cancer (n = 4,729). The authors found that Part D was associated with a 43 percent decline in OOP costs and fewer outpatient visits.33 Studies among women with breast cancer have found that Part D was associated with reduced mortality, improved adherence to medicine, and reduced racial/ethnic disparities.34,35 More broadly, researchers have failed to find any associations between Part D enrollment and self-reported health status, limitations in activities of daily living and instrumental activities of daily living, ED visits and hospital admissions (prevalence, counts, and spending), or death among Medicare enrollees, according to nationally representative data from the Medicare Current Beneficiary Survey (n = 56,293) combined with Medicare claims.36 One study that did examine the effect of Part D on ED visits among a general Medicare population found that, using a difference-in-differences approach, Part D enrollment reduced non-urgent ED visits but not urgent ED visits.37 The authors’ findings support our conclusion in this study: Part D may have led to better health management and reduced unnecessary ED usage.

          The current study excluded Medicare Advantage (MA) enrollees; they are not included in SEER-Medicare, although they represent a large and growing group of seniors. Part D studies using only Medicare FFS claims could be susceptible to confounding because of an increase in MA enrollment during the study period. We addressed this by including an index year indicator in the models, which adjusts for differences in MA enrollment over time. We have no reason to suspect that including MA enrollees would have changed our findings; however, this is an area deserving further exploration.

          Although we have characterized groups in terms of complete vs. partial/no Part D enrollment, most of those in the partial/no Part D group probably had some kind of insurance coverage for prescription drugs, whether through a former employer or union, some other program, or self-funded; still, an estimated 12 percent of Medicare beneficiaries had no drug coverage during the study period.26 Unfortunately, our data did not provide any information about alternative coverage or lack thereof.

          Our outcome measures were limited to ED visits and hospitalizations during the 12-month period after diagnosis. Despite these limitations, our study’s relatively large sample of more than 25,000 Medicare beneficiaries, along with a matched-cohort design using the reliable and well-validated SEER-Medicare database, allows us to get a clearer picture of costs, enrollment patterns, and health outcomes among people with CRC and similar people without cancer. Future research is needed to understand a broader set of potential outcomes, including OOP costs, ideally with better information on prescription drug coverage among those not covered by Part D.

          Acknowledgments

          The findings and conclusions in this manuscript are those of the authors and do not necessarily represent the official position of the Centers for Disease Control and Prevention or RTI International.

          Funding support for Lisa M. Lines, Sujha Subramanian, and Sonja Hoover was provided by the Centers for Disease Control and Prevention (Contract No. 200-2008-27958-0036, to RTI International). The authors declare no conflicts of interest.

          RTI Press Associate Editor: Franziska Rokoske

          References

          1Mariotto AB, Yabroff KR, Shao Y, Feuer EJ, Brown ML. Projections of the cost of cancer care in the United States: 2010-2020. J Natl Cancer Inst 2011;103(2):117–28. 10.1093/jnci/djq49521228314
          2Hsu J, Fung V, Price M, Huang J, Brand R, Hui R et al. Medicare beneficiaries’ knowledge of Part D prescription drug program benefits and responses to drug costs. JAMA 2008;299(16):1929–36. 10.1001/jama.299.16.192918430912
          3Tamblyn R, Laprise R, Hanley JA, Abrahamowicz M, Scott S, Mayo N et al. Adverse events associated with prescription drug cost-sharing among poor and elderly persons. JAMA 2001;285(4):421–9. 10.1001/jama.285.4.42111242426
          4Lichtenberg FR, Sun SX. The impact of Medicare Part D On prescription drug use by the elderly. Health Aff 2007;26(6):1735–44.
          5Lines LM. Out-of-pocket healthcare expenditures for cancer patients in the United States: A population-based analysis. Amherst (MA): School of Public Health, University of Massachusetts; 2008.
          6Lines LM. Out-of-pocket healthcare expenditures for cancer patients in the United States: findings from the Medical Expenditure Panel Survey. 9th Annual Health Services and Outcomes Research Conference; 2008 Dec 3; Houston, TX.
          7Kircher SM, Johansen ME, Nimeiri HS, Richardson CR, Davis MM. Impact of Medicare Part D on out-of-pocket drug costs and medical use for patients with cancer. Cancer 2014;120(21):3378–84. 10.1002/cncr.2889824962682
          8National Cancer Institute. Number of Part D Enrollees. 2016 [cited 2016 Dec 6]. Available from: https://healthcaredelivery.cancer.gov/seermedicare/aboutdata/enrollees.html.
          9Medicare.gov. 3 ways to avoid the late enrollment penalty. 2018 [cited 2018 Oct 6]. Available from: https://www.medicare.gov/drug-coverage-part-d/costs-for-medicare-drug-coverage/part-d-late-enrollment-penalty/3-ways-to-avoid-the-part-d-late-enrollment-penalty.
          10Blanchard J, Madden JM, Ross-Degnan D, Gresenz CR, Soumerai SB. The relationship between emergency department use and cost-related medication nonadherence among Medicare beneficiaries. Ann Emerg Med 2013;62(5):475–85. .10.1016/j.annemergmed.2013.04.013
          11Today M. Senior satisfaction survey. 2016 [cited 2016 Dec 7]. Available from: http://medicaretoday.org/resources/senior-satisfaction-survey/.
          12Semilla AP, Chen F, Dall TM. Reductions in mortality among Medicare beneficiaries following the implementation of Medicare Part D. Am J Manag Care 2015;21(9 Suppl):s165–171.
          13Kaestner R, Long C, Alexander GC. Effects of prescription drug insurance on hospitalization and mortality: evidence from Medicare Part D. Cambridge, MA: National Bureau of Economic Research; 2014. 10.3386/w19948
          14Kaestner R, Khan N. Medicare Part D and its effect on the use of prescription drugs and use of other health care services of the elderly. J Policy Anal Manage 2012;31(2):253–79. 10.1002/pam.21625
          15Liu FX, Alexander GC, Crawford SY, Pickard AS, Hedeker D, Walton SM. The impact of Medicare Part D on out-of-pocket costs for prescription drugs, medication utilization, health resource utilization, and preference-based health utility. Health Serv Res 2011;46(4):1104–23. 10.1111/j.1475-6773.2011.01273.x21609328
          16Hoadley J. Medicare Part D spending trends: understanding key drivers and the role of competition. 2012 [cited 2018 Oct 6]. Available from: https://www.kff.org/health-costs/issue-brief/medicare-part-d-spending-trends-understanding-key/.
          17National Cancer Institute. SEER-Medicare publications by journal & year. 2017; [cited 2017 Oct 6]. Available from: https://healthcaredelivery.cancer.gov/seermedicare/overview/pubs_jour_year.php.
          18Chawla N, Yabroff KR, Mariotto A, McNeel TS, Schrag D, Warren JL. Limited validity of diagnosis codes in Medicare claims for identifying cancer metastases and inferring stage. Ann Epidemiol 2014;24(9):666–72. e662. 10.1016/j.annepidem.2014.06.099
          19Klabunde CN, Potosky AL, Legler JM, Warren JL. Development of a comorbidity index using physician claims data. J Clin Epidemiol 2000;53(12):1258–67. 10.1016/S0895-4356(00)00256-011146273
          20National Cancer Institute. NCI Comorbidity Index Overview. 2019 [cited 2020 Mar 5]. Available from: https://healthcaredelivery.cancer.gov/seermedicare//considerations/comorbidity.html.
          21Hanchate AD, Clough-Gorr KM, Ash AS, Thwin SS, Silliman RA. Longitudinal patterns in survival, comorbidity, healthcare utilization and quality of care among older women following breast cancer diagnosis. J Gen Intern Med 2010;25(10):1045–50. 10.1007/s11606-010-1407-920532657
          22Snyder CF, Frick KD, Kantsiper ME, Peairs KS, Herbert RJ, Blackford AL et al. Prevention, screening, and surveillance care for breast cancer survivors compared with controls: changes from 1998 to 2002. J Clin Oncol 2009;27(7):1054–61. 10.1200/JCO.2008.18.095019164212
          23Lang K, Lines LM, Lee DW, Korn JR, Vanness DJ, Earle C et al. Differences in colorectal cancer treatment costs by treatment phase, cancer site, and stage at diagnosis: evidence from linked SEER-medicare data. Value Health 2008;11(3):A65–6. 10.1016/S1098-3015(10)70217-5
          24U.S. Bureau of Economic Analysis. Gross domestic product: implicit price deflator. 2017 [cited 2017 Oct 2]. Available from: https://fred.stlouisfed.org/series/GDPDEF.
          25Lines LM, Menzin J, Lang K, Korn JR, Neumann PJ. Predictors of enrollment in Medicare Part D: are beneficiaries rational? Value Health 2009;12(3):A15. 10.1016/S1098-3015(10)73134-X
          26Hoadley J, Summer L, Hargrave E, Cubanski J, Neuman T. Medicare Part D in its ninth year: the 2014 marketplace and key trends, 2006–2014. 2014 [cited 2017 Oct 6]. Available from: https://www.kff.org/report-section/medicare-part-d-in-its-ninth-year-section-1-part-d-enrollment-and-plan-availability/.
          27D’Amato SL. New oral chemotherapeutic agents: Part B vs. Part D Implications. n.d. [cited 2017 Mar 7]. Available from: http://www.amcp.org/WorkArea/DownloadAsset.aspx?id=12097.
          28American Cancer Society. Medicare Part D: things people with cancer may want to know. n.d. Available from: http://www.cancer.org/treatment/finding-and-paying-for-treatment/understanding-health-insurance/government-funded-programs/medicare-medicaid/part-d.html.
          29Jha AK, Aubert RE, Yao J, Teagarden JR, Epstein RS. Greater adherence to diabetes drugs is linked to less hospital use and could save nearly $5 billion annually. Health Aff 2012;31(8):1836–46.
          30Brown MT, Bussell JK. Medication adherence: WHO cares? Mayo Clin Proc 2011;86(4):304–14. 10.4065/mcp.2010.057521389250
          31Reynolds K, An J, Wu J, Harrison TN, Wei R, Stuart B et al. Treatment discontinuation of oral hypoglycemic agents and healthcare utilization among patients with diabetes. J Diabetes Complications 2016;30(8):1443–51. 10.1016/j.jdiacomp.2016.07.02127506310
          32Lines LM, Rosen AB, Ash AS. Enhancing administrative data to predict emergency department utilization: The role of neighborhood sociodemographics. J Health Care Poor Underserved 2017;28(4):1487–508. 10.1353/hpu.2017.012929176110
          33Kircher SM, Johansen ME, Nimeiri HS, Richardson CR, Davis MM. Impact of Medicare Part D on out-of-pocket drug costs and medical use for patients with cancer. Cancer 2014;120(21):3378–84. 10.1002/cncr.2889824962682
          34Nattinger AB, Wozniak EM, McGinley EL, Li J, Laud P, Pezzin LE. Socioeconomic disparities in mortality among women with incident breast cancer before and after implementation of Medicare Part D. Med Care 2017;55(5):463–9. 10.1097/MLR.000000000000068528030476
          35Biggers A, Shi Y, Charlson J, Smith EC, Smallwood AJ, Nattinger AB et al. Medicare D subsidies and racial disparities in persistence and adherence with hormonal therapy. J Clin Oncol 2016;34(36):4398–404. 10.1200/JCO.2016.67.335027998232
          36Briesacher BA, Madden JM, Zhang F, Fouayzi H, Ross-Degnan D, Gurwitz JH et al. Did Medicare Part D affect national trends in health outcomes or hospitalizations? A time-series analysis. Ann Intern Med 2015;162(12):825–33. 10.7326/M14-072626075753
          37Ayyagari P, Shane DM, Wehby GL. The impact of Medicare Part D on emergency department visits. Health Econ 2017;26(4):536–44. 10.1002/hec.332626865471

          Click cover to download publication

          Keep Exploring

          • icon-externallink-blue Created with Sketch.

            HTML version [PubMed]

          Sustainable Development Goals

          • Goal 3: Good Health and Well Being

          Contact

          To contact an author or seek permission to use copyrighted content, contact our editorial team

          • +1 919 541 6490
          • rtipress@rti.org

          Meet the Experts

          View All Experts
          Lisa M. Lines

          Lisa M. Lines

          Sujha Subramanian

          Related Publications

          View All Press
          OCCASIONAL PAPER

          Bringing an equity-centered framework to research

          OCCASIONAL PAPER

          Culturally informed community engagement

          RESEARCH REPORT

          Substance misuse prevention program attendance

          RESEARCH BRIEF

          COVID-19’s impact on clinical research

          OCCASIONAL PAPER

          Social determinants of health

          OCCASIONAL PAPER

          Challenges facing CAHPS surveys and opportunities for modernization

          RESEARCH REPORT

          Artificially intelligent social risk adjustment

          OCCASIONAL PAPER

          The need for a diverse environmental justice workforce

          Recent Publications

          View All Press
          OCCASIONAL PAPER

          Bringing an equity-centered framework to research

          OCCASIONAL PAPER

          The Preschool Entitlement

          OCCASIONAL PAPER

          Culturally informed community engagement

          RESEARCH REPORT

          Substance misuse prevention program attendance

          RTI Logo
          Partner With Us
          • US Government
          • Commercial
          • Foundations & Associations
          • Multilateral Donors
          • Universities
          • Suppliers
          Site
          • Privacy Policy
          • Security Policy
          • Site Map
          • Terms of Use
          • Accessibility
          • Contact Us
          Contact Us
          Facebook Icon Twitter Icon Instagram Icon YouTube Icon Linkedin Icon
          delivering the promise of science
          for global good
          RTI Health Solutions RTI Innovation Advisors RTI Health Advance

          © 2023 RTI International. RTI International is a trade name of Research Triangle Institute. RTI and the RTI logo are U.S. registered trademarks of Research Triangle Institute.