As growth in West Virginia’s traditional industries has slowed, state leaders recognize the need to develop new high-growth industries with higher-paying jobs. These jobs increasingly come from health care, advanced manufacturing, the tech sector, and other science and technology-based industries. How can West Virginia encourage these sectors to grow? Our recent work sheds some light on this question and suggests an evidence-based course of action.
The National Science Foundation’s National Center for Science & Engineering Statistics (NCSES) manages the data collection and reporting on all aspects of Science and Engineering (S&E) in the United States. The National Science Board submits a S&E Indicators report biennially to Congress and the President. Policymakers and researchers use the S&E Indicators to assess the state of S&E in the United States and to consider its implications for federal investments and policies, relative to other countries, to maintain and advance U.S. economic competitiveness.
Since 2004, RTI has authored the S&E Indicators chapter on elementary and secondary science, technology, engineering, and mathematics (STEM) education. We also recently began serving as a co-author on the public perceptions and awareness of science and technology chapter.
In addition to national data, the S&E Indicators provide state-level, time-series data and benchmarking on metrics related to S&E education and workforce, research and development (R&D) inputs and outputs, and high-tech economic activity. When these data are paired with other targeted economic analysis and qualitative interviews, they represent an important diagnostic tool for analyzing the strengths and weaknesses of a state’s science and technology (S&T) enterprise. Strategies can then be developed to increase S&T competitiveness and innovation-based economic growth.
RTI, and our partner, Keen Point Consulting, recently developed a five-year S&T strategic plan for West Virginia, in close collaboration with the West Virginia Science and Research Council and the Division of Science and Research within the West Virginia Higher Education Policy Commission.
We used NSF S&E Indicators data to analyze trends in West Virginia R&D activity, S&E workforce, and high-tech economic activity and to inform decisions about where West Virginia policymakers should be focusing its time and investments.
For example, according to S&E Indicators data:
- Industry R&D: Industry is typically the largest performer of R&D in industrialized economies accounting for 2-3% of private sector output. West Virginia has experienced a sharp decline in business R&D spending over the past 20 years from 1.0% of private sector output in 1998 to 0.36% in 2018. West Virginia is a small state that used to be a global center of petrochemical R&D and innovation, and it will take a new generation of R&D-intensive companies to re-orient West Virginia’s economy.
- Academic R&D: Academic R&D spending by West Virginia institutions of higher education has grown over the past 10 years, but at a slower than average rate for all U.S. academic institutions (2.3% CAGR vs. 3.5% CAGR, FY2009-FY2019).
- STEM workforce: West Virginia performs close to the U.S. average in the percentage of workers in technical occupations (1.2% of all jobs compared to 1.3% in the U.S.). However, the percentage of West Virginia jobs that require scientists and engineers is 3.1% compared to 4.9% nationally reflecting the lower level of business R&D activity.
What specific actions can West Virginia take to generate more high-tech and research-based economic activity based on these S&E Indicators findings?
West Virginia needs sustained, higher-than-average growth in business creation, company attraction, and business expansion to improve the pace of real GDP growth and per capita income growth in the coming decades. Many of the industries characterized by higher-wage jobs and stronger employment growth in West Virginia and nationally are in high-tech services and manufacturing.
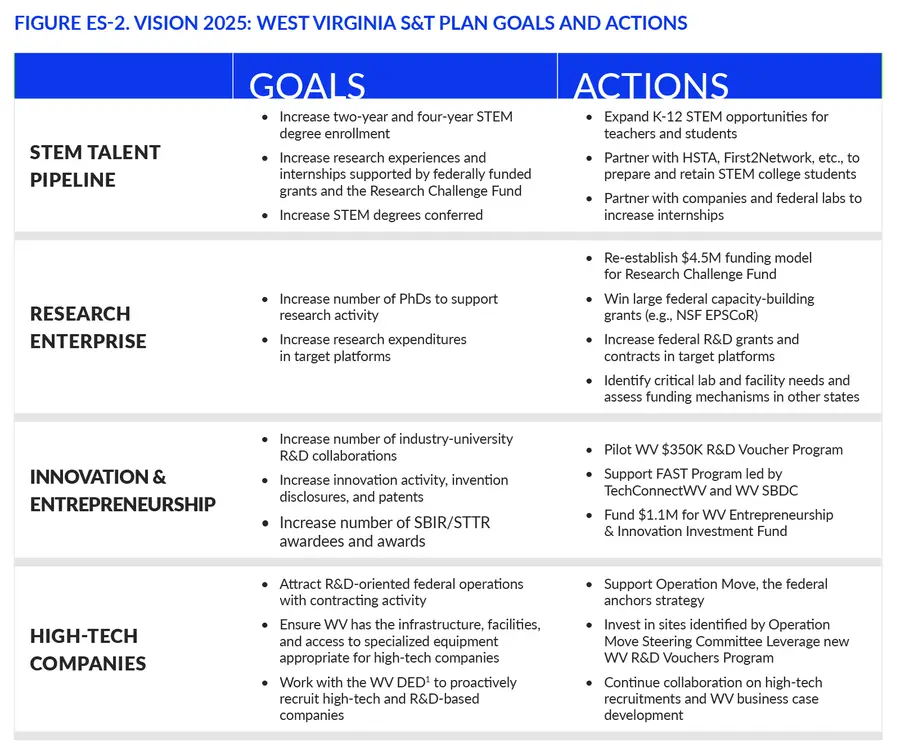
West Virginia’s S&T Plan, Vision 2025, presents a set of goals and actions for strengthening the science, technology, engineering, and mathematics (STEM) talent pipeline, expanding the research enterprise, catalyzing more innovation and entrepreneurship activity and supporting the growth of high-tech companies in four target S&T platforms in the next 5 years.