Insights


We all, at one time or another, wish we had a crystal ball. We may want it to help us make a simple decision, like “should we go camping this weekend,” or to answer a heavy question, like “when will the COVID-19 pandemic be over.” Though crystal balls only exist in fairy tales (don’t tell my daughter), several fields of science come close to harnessing their capabilities, generating forecasts of future conditions based on known or perceived patterns and processes. As mere humans and dwellers of reality, we understand that all forecasts are approximations and rarely end up being exactly right. Thus, a natural and important question that arises when basing a decision on a forecast is – “how good is this forecast”?
In the field of water resources, forecasts of streamflow are used to guide hydropower, emergency management and water supply decisions, among others. Despite the often-critical nature of these decisions, methods to assess forecast skill (i.e. how good is the forecast) are not industry-standardized nor well-defined. Claims of accuracy (e.g. “my forecasts are 93% accurate”) are often based on a single metric, like R2, that by itself can provide misleading perception of forecast skill and leave forecasters scratching their heads over what they initially thought was an A-grade score.
The paradox of statistical metrics
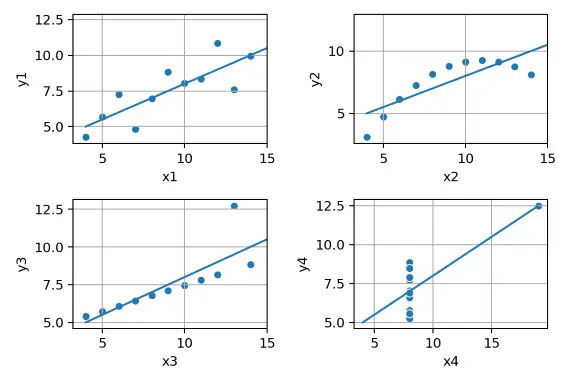
A classic example of inappropriate representation of simplified scores can be demonstrated with Anscombe's Quartet (see Figure). Four different sets of data have the same correlation, R2, linear regression, mean, and variance, and yet are completely different datasets when graphed visually. Forecast evaluation requires more robust measures of skill to be useful for evaluating the forecasts or, more importantly, for deciding if and how to use the forecasts in decision-making.
Evaluation is a process that, rather than assessing a single or even a specific set of metrics measuring forecast skill, varies between different end-users interested in using forecast information to make different decisions. To illustrate this, let's break evaluation down by a few key streamflow forecast characteristics:
- Horizon - as forecasts move further into the future, their skill decreases. It is helpful to define forecast skill at a range of forecast horizons. How well we are forecasting river flows tomorrow, next week, or next month all require different evaluation scores.
- Magnitude - hydrographs are continuous processes that are measured in regular intervals with varying magnitudes over time. Forecasting low-flow baseflow conditions is different than forecasting peak flood flows, and yet the skills for each are commonly aggregated into a single metric (e.g. Nash-Sutcliffe or Kling-Gupta). It may be beneficial to break up the forecast skill by the type of flow condition being measured.
- Season - forecast skill will vary during the year as the runoff-generating processes change. For example, the skill in forecasting multi-week flows in snow-dominated regions during the spring freshet will be higher than for the same period when runoff would be storm-dominated. Breaking out horizons and magnitudes by season will increase your understanding of forecast skill.
Which measure of evaluation skill is important ultimately depends on the decisions being made, which are informed by forecasts. For example, emergency managers might be interested in peak flows a few hours ahead, whereas dam operators selling power into day-ahead markets may be interested only in 24-hour forecast volumes. Other dam operators may need to manage reservoir storage for flood control or water supply and be looking several days, weeks, or even months ahead. The first two cases require forecast skill on flood peaks, whereas energy marketers may be more focused on more common day-to-day flow conditions. Offered two sets of forecasts, one operator may forego skill in a certain horizon and magnitude range to increase skill elsewhere.
Unlocking the benefits for practical application
Evaluation of streamflow forecasts is not commonplace throughout industry - why? It's not due to a lack of academic literature, which is flush with resources to help forecasters, managers, and operators evaluate forecast skill with 100's of different metrics. Instead, it is more likely due to a lack of access to the infrastructure required to support a robust evaluation process. Evaluation requires specialized databases to store every forecast generated in addition to the observed conditions. For deterministic (single trace) forecasts, this can be challenging, but it is even more daunting for ensemble (multi-trace) forecasts. Second, systems able to access, process, extract, and visualize these forecasts are also required. With so many organizations using different databases, data structures, forecast horizons and frequencies, it can be challenging to manage the large data quantities required. Furthermore, real-time systems can produce and accumulate very large amounts of forecast performance metrics – who has the time to look at all that information? Careful thought must be given to efficiently visualize the evaluation results so that industry users can interpret them for practical applications.
With a robust evaluation system at hand, decision-makers can adjust their expectations of forecast performance and how they use the information in decisions, e.g. whether the flow is 100 ± 3 or 100 ± 30 can have a big difference on current decisions. Likewise, for users and organizations that generate their own forecasts or use publicly available data, evaluation can indicate where and how to improve the forecasts where it matters most. Thus, operating a robust evaluation system in addition to a forecast system can lead to a wide range of potential benefits.
So, if you ever hear someone claim their forecast is 93% accurate, dig a little deeper to better understand what their forecasts are actually showing and how such skill is impacting their decision-making process. Their crystal ball may be telling an incomplete tale.
Learn more about our forecasting and monitoring services to see how we can support your organization.
Stay up-to-date on the latest insights from the Center for Water Resources by signing up for our monthly newsletter.
Disclaimer: This piece was written by Jonathan Quebbeman (Director, Water Resources) and Michael Thiemann (Senior Water Resources Engineer and Data Systems Architect) to share perspectives on a topic of interest. Expression of opinions within are those of the author or authors.