

You can use all the quantitative data you can get, but you still have to distrust it and use your own intelligence and judgment. – Alvin Toffler
One of the first questions we ask when we’re developing a water resources modeling project is, “How much data is available?” (Actually, one of the first questions is whether we should say that “data is available” or that “data are available,”—but that’s a topic for another blog.) We may be looking for historical data with which to calibrate our models or, in the case of a real-time river forecasting system, we want to know if forecast data is available.
Then, once we determine how much data is available—and rarely is there ever enough—the second question we must ask is, “How trustworthy is it?” The RTI International Center for Water Resources (CWR) has extensive expertise in determining how to account for any anomalies that may exist in data while still making impactful analyses.
Inherent errors in hydrologic observations have been well documented. For example, it’s well known that many streamflow rating curves are measured during high flows and, therefore, estimates of discharge based on river stage at low flows may not be as accurate. And recently, a weather radar over Las Vegas showed two storms over the area: one north of the city that was rain, and one south of the city that was actually a horde of airborne grasshoppers.
There are processes in place to handle a majority of inherent errors, but how can we properly identify and mitigate non-traditional anomalies in hydrologic measurements? These issues are often hidden in the thousands of data points in a historical record of observations and must be teased out through novel quality control steps or by simply noticing that something looks abnormal during the model calibration or forecast product development. With more than 30 years of experience implementing projects around the world, it has become second nature for our CWR experts to flag potentially abnormal activity within historical or forecast datasets for further inspection.
Take rainfall data collection as an example. Because precipitation is a highly spatial variable, it appears that rain gage records are more prone to anomalous values due to several possible factors. It is not uncommon to identify a large anomalous value in a gage record that stands out for the time of year (Figure 1).
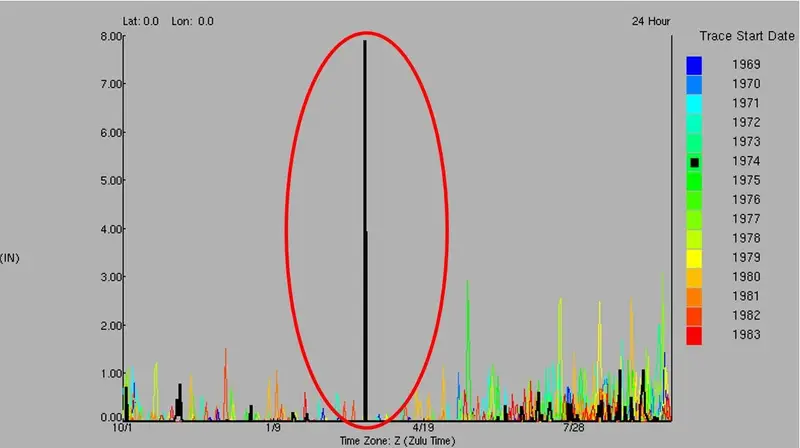
Figure 1 – Outlier values
Checking nearby gages and river flows around this date are standard means of verification, but we also check news reports and weather statements around this date since it’s never clearly obvious whether a value is in error.
For a project in Mexico, a graph of the data showed one particular year when the precipitation record at a site was inexplicably switched with evaporation data (Figure 2).
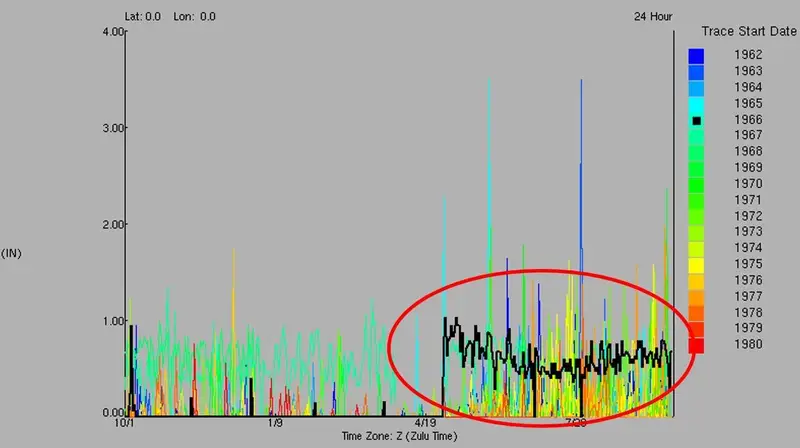
Figure 2 – Evaporation data switched with precipitation data
This issue became obvious when we looked at monthly totals for the period and saw that these months far exceeded any other month in the record.
Figure 3 shows a more subtle issue: this graph depicts a pattern of daily rainfall totals that repeated across three months.
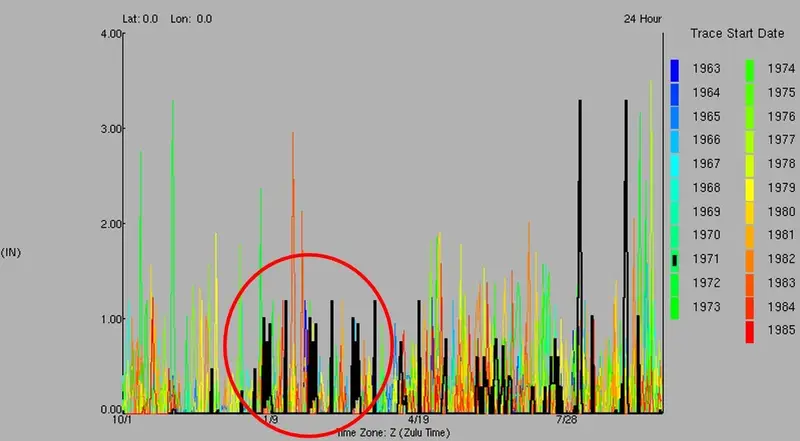
Figure 3 – Repeating values over the course of three months
It took a hydrologist with a sharp eye to notice this trend when reviewing each year’s daily precipitation plot. Again, it’s not obvious whether these data values are in error, but they seemed very suspicious and were flagged so they could be vetted.
Non-traditional anomalies can also stem from one’s ability to collect hydrometeorological data to begin with.
For instance, when working on a forecast system installation in El Salvador in 2000, we asked why almost all precipitation gage data during the 1980’s was missing. The reply was simply that they could not collect data in remote areas during the civil war.
A hinderance to data collection was also the case in an instance of modeling historical reservoir operations in the U.S. for a large reservoir system. In this case, we noticed that the operating rules we had written for the model called for a reservoir release on a given day, when the actual release wasn’t made until 1-2 days later. This frequently occurred around a weekend and only in remote reservoirs without automatic gate operations. The river operations office that was responsible for dispatching staff to manually open the gates reviewed the operating records and determined that in most of the identified cases, the adjustments to releases were small. The root cause, however, was that the operators would not tell staff to drive out to the remote location and open the gates on a weekend because they didn’t want to pay the overtime rates.
Who would have thought that in trying to validate data, you’d have to take armed conflict and worker’s compensation budgets into account?
Generally, we tend to believe values from historical records of hydrometeorological data, but these values can’t always be taken as the ultimate truth. When questions arise, we turn to automated QC scripts, visual inspection, and irregularities in modeling results to help us identify bad data. Oftentimes, it comes down to a lot of experience and a little bit of instinct – if it doesn’t feel right, it’s time to look more closely.
If you need a second opinion or anomaly specialist for your water data, we’re here for you! Check out our RTI CWR Services to learn more about how we can help.
Disclaimer: This piece was written by Michael Kane (Director, RTI Center for Water Resources) to share perspectives on a topic of interest. Expression of opinions within are those of the author or authors.