Insights

The challenge of quantifying risk in the face of climate change on the east coast
High in the Appalachian Mountains of Western North Carolina, there is a hydrologic ‘four corners’ where the headwater boundaries of four major river basins converge – the New, Watauga, Yadkin and Catawba Rivers. I live nearby, along the upper reach of the New River, in the small college town of Boone, NC. As a hydrologist, moving into a house along a stream in the mountains was, in part, a dream-come-true - my science, my source of fascination, and the centerpiece of my preferred pastimes were right outside my door. Rather than checking the nearest gauge data online, I could peer out my door to judge if the river was prime for canoeing; rather than driving across town to dip my feet in cool swirling eddies in the summer, I could scramble down the bank at the edge of my yard; and rather than dragging my kids in the car to see raging streams after downpours, I could drag them to the bedroom window (and endure far fewer renditions of – “can we PLEASE go home now Mom?”).
That said, as a hydrologist, I also knew all too well that moving into a house on a riverbank came with risks. Like most others in my field, when I hear the words “mountain stream,” I promptly think “flash flood.” Before we moved in, the owner told us the river had not risen above its bank since his family built the house in 1955. I checked historic records and FEMA maps, confirming the house was outside of the 500-year floodplain, thanks to the height of the streambank. This was reassuring, but I also knew such maps are fraught with uncertainty and assumptions of stationarity. Nevertheless, indulgence and family pleas prevailed.
Perceptions of Flood Risk
Talking with others around town, we quickly learned that certain spots within the community flood on a regular basis – the Boone Mall, Deerfield Rd, portions of App State campus, and many more. Sure enough, within a few weeks of moving into town, we got the chance to see the flooding for ourselves. A few months later it happened again…. then again… and again. Each time, I watched the water level like a hawk, checked downstream data, and made rough forecasts of peak flow at our house. In most events, the river peaked between three to five- feet higher than baseflow, but still well below the top of the bank.
Then came October 2017, when nearly six inches of rain fell over a few hours. Two weeks earlier, five inches had fallen in one day, and it had rained on and off since. The ground was saturated. Large sections of town were underwater. The damage was significant. Our house stayed dry, but the river swelled uncomfortably close to bankfull. It was one of the worst floods in Boone in recent years, but it was not the result of one of the many recent hurricanes to hit this State.
Being far inland, Boone generally fares better than other parts of the state during hurricanes. Stories are endless of the devastation caused by the hurricanes in the last four years - Matthew (2016), Florence (2018), Michael (2018) and Dorian (2019). Those storms, Florence in particular, dumped unfathomable quantities of rain on the coast and hundreds of miles inland. Some towns that were devasted during Matthew flooded again during Florence two years later. Even up in Boone, rainfall forecasts ahead of Florence were frightening, reaching as high as 20 inches, as the storm track was projected to come inland and stall for days.
In the end, the 8.5 inches of rain that fell in Boone during Florence over three days caused some flooding, but less than the (non-hurricane) six-hour deluge the year before. The river stayed a few feet below the top of the bank at our house; we were lucky again. Like many others though, I watched the news during those hurricanes, my heart breaking over and over for the thousands of families who were not so lucky, losing their homes, everything they owned or, in some tragic cases, a loved one.
The frequency and magnitude of heavy rainfall, from hurricanes or otherwise, is the topic of much discussion now across the Southeast. I am getting questions from friends and neighbors about flooding, since many perceive these events to be happening more often or in new places. Sometimes I have answers. For example, if someone asks “why did six inches of rain last year cause worse flooding than eight inches this year,” I happily launch into some hydrology basics. Other times, I don’t have answers. If someone asks, “is the flood risk in Boone increasing with climate change?”, I must resort to an unsatisfying “maybe”.
Climate scientists agree that, on a global scale, the planet is warming. They also agree that the warming is causing sea levels to rise, increasing flood risk in coastal communities worldwide1. For inland locations, where precipitation drives flooding, they agree…it’s complicated. A warmer atmosphere holds more moisture, so with all other factors the same, a storm that forms in a warmer atmosphere will hold, and release, more water. The “all other factors the same” is the complicated part since many factors could affect how precipitation patterns may change and ultimately which regions will receive more, and which will receive less, precipitation.
Predicting Future Trends for NC
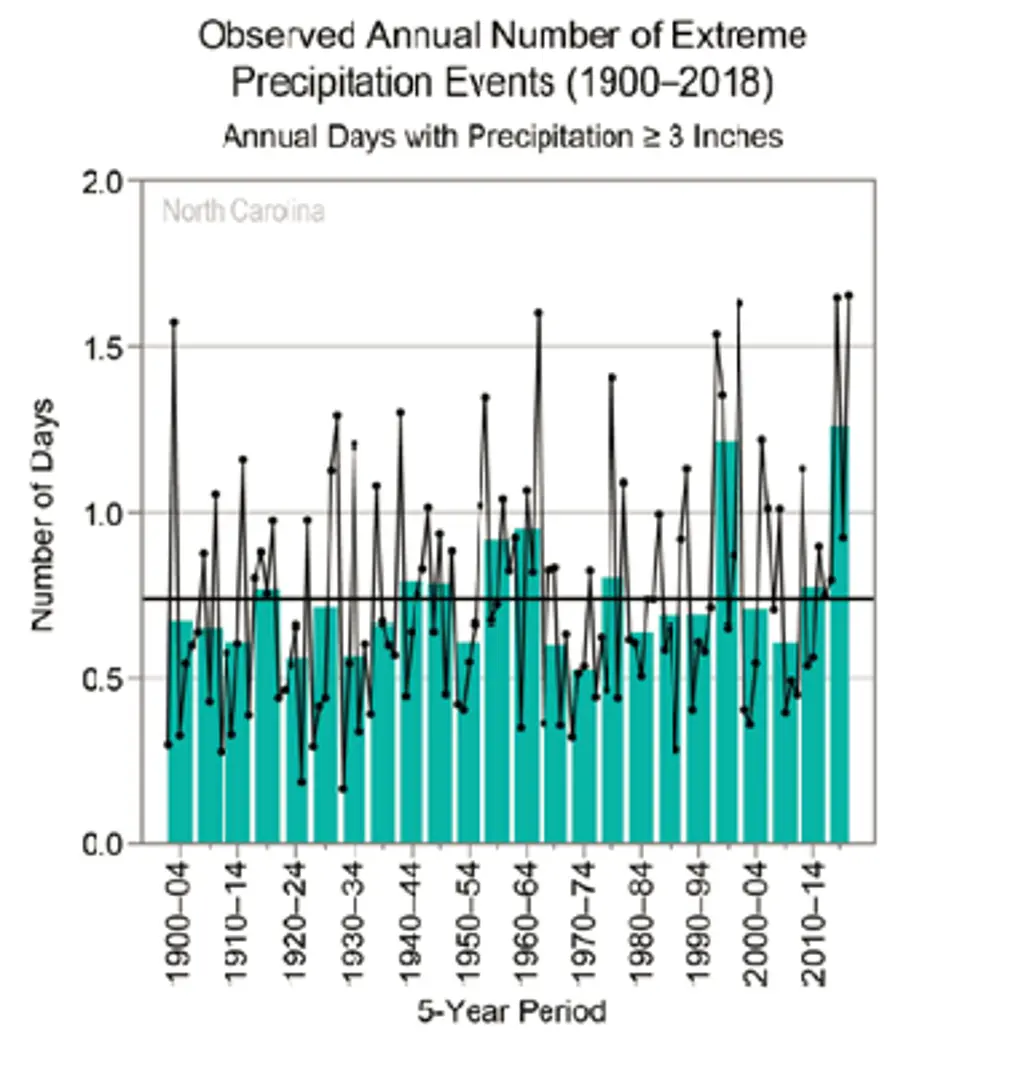
Precipitation records may provide one source of indication of things to come. A recent and ongoing assessment by the North Carolina Institute for Climate Studies (NCICS) found that, although there is no clear long-term trend in annual total precipitation in historical records in North Carolina, there is an upward trend in the number of heavy rainfall events. Contributing to that trend, 2018 was the wettest year on record for the state, and 2015-2018 saw the largest number of heavy precipitation events of any three-year period in more than 100 years of records2. Recent perceptions, it seems, are justified. But are those trends indicative of a systematic shift?
NCICS concludes that it is ‘very likely’ that extreme precipitation frequency and intensity will increase in North Carolina. Most signs are pointing to increasing moisture content leading to more thunderstorms, more intense hurricanes, and more inland flooding2. It appears that I should change my answer from “maybe” to “very likely” on the flood risk in Boone question. But what does that really mean? How do engineers and scientists, whose job it is to quantify ambiguous terms like ‘risk’, ‘frequency’, or ‘intensity’, account for this ‘very likely’ trend for future planning or design? How do we turn ‘very likely’ into a design criterion?
One of the most pressing questions in our field is where and how to update precipitation and flood frequency analyses to account for a nonstationary climate. Such analyses (e.g. the magnitude of a “100-year flood”) are used for risk assessments, floodplain mapping, dam design, culvert sizing and a whole host of other engineering design applications. Scientists are working on this question, including some of my RTI Center for Water Resources colleagues and our partners, exploring methods to estimate future shifts in the statistical distributions of rainfall and flood events [4].
In the meantime, my family and I will need to decide if we will stay in our house knowing it is only a matter of time before the river will finally crest the bank. Given the question of whether we will stay or go, I resort again to an unsatisfying, and admittedly unwise, “maybe.” The peaceful mountain stream lures me, while high water marks taunt me. I’m a hydrologist, but I’m human. On this, the river and I agree… it’s complicated.
Katie van Werkhoven provided a glimpse into the impacts of climate change on hydrology on the East Coast. Check out an additional post in this series focused on the West Coast to learn how climate change impacts vary based on geographic region.
Visit Katie van Werkhoven’s expert profile for more information on her experience in hydrology.
Sources:
[1] USGCRP, 2018: Impacts, Risks and Adaptation in the United States: Fourth National Climate Assessment, Volume II [Reidmiller, D.R., C.W. Avery, D.R. Easterling, K.E. Kunkel, K.L.M. Lewis, T.K. Maycock, and B.C Stewart (eds.)]. U.S. Global Change Research Program, Washington, DC, USA, 1515 pp. doi: 10.7930/NCA4.2018
[2] Kunkel, K.E., D.R. Easterling, A. Ballinger, S. Bililign, S.M Champion, D.R. Corbett, K.D. Dello, J. Dissen, G.M. Lackmann, R.A. Luettich, Jr., L.B. Perry, W.A. Robinson, L.E. Stevens, B.C. Stewart, and A.J. Terando, 2020: North Carolina Climate Science Report. North Carolina Institute for Climate Sciences, 233 pp. https://ncics.org/nccsr
[3] Frankson, R., K. Kunkel, L. Stevens, D. Easterling, W. Sweet, A. Wootten, and R. Boyles, 2017: North Carolina State Climate Summary. NOAA Technical Report NESDIS 149-NC, May 2019 Revision. 4 pp. https://statesummaries.ncics.org/chapter/nc/
[4] Quebbeman, J.Q., 2020. Incorporating Climate Change in Engineering Evaluations and Risk Assessments. 2020 FEMA Hazard Mitigation Partners Workshop.
Disclaimer: This piece was written by Katie van Werkhoven (Senior Water Resources Engineer) to share perspectives on a topic of interest. Expression of opinions within are those of the author or authors.